What Is Market Breadth?
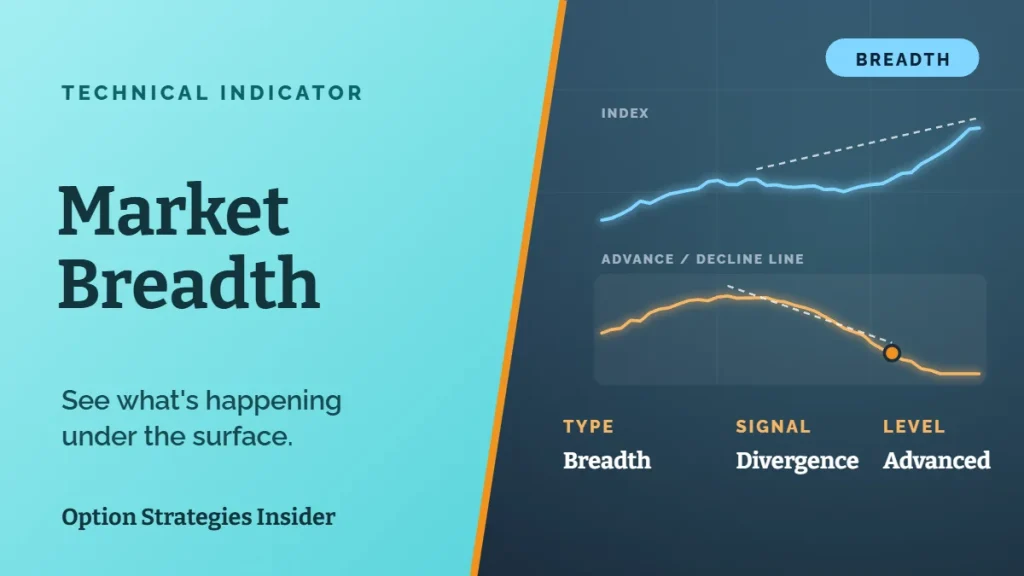
Market breadth measures how many stocks are taking part in a move. Are most stocks rising with the market, or is a small group doing all the heavy lifting? Think of it like an army. If the whole army is marching forward, the advance is strong. If only the generals are moving and the troops are retreating, that advance won’t last long. Most of the time, breadth and price move together. In a healthy uptrend, the majority of stocks rise and breadth looks strong. In a downtrend, most stocks fall and breadth weakens. When they agree, you can mostly ignore breadth and just follow the trend. The moment to pay attention is when they disagree. When a major index like the S&P 500 keeps pushing to new highs while fewer and fewer stocks join the party, that’s called a breadth divergence. It usually means a handful of giant companies are carrying the whole index on their backs. Here are three market breadth indicators that help you spot it.Indicator 1: The Advance/Decline Line
The advance/decline line is the classic breadth tool, and it’s simple to understand. Every day, you take the number of stocks that went up and subtract the number that went down. If 1,800 stocks on the New York Stock Exchange rose and 1,200 fell, that day’s reading is +600. Then you add that number to the previous day’s total. Over time, you get a running line. When most stocks are rising, the line climbs. When most stocks are falling, it drops. In a healthy market, the advance/decline line should be making new highs right alongside the index. The warning sign is when the index makes a new high and the advance/decline line doesn’t. That tells you the gains are coming from fewer stocks, usually the biggest names with the most weight in the index. History has some famous examples. The NYSE advance/decline line peaked in 1998, roughly two years before the S&P 500 topped out in March 2000. Breadth also weakened for months before the market peaked in October 2007. Neither divergence called the exact top, but both were early warnings that the rally was getting thin.
Indicator 2: Percentage of Stocks Above the 200-Day Moving Average
The second indicator looks at trends instead of daily moves. A moving average smooths out the day-to-day noise by averaging a stock’s price over a set period. The 200-day moving average is the most widely watched measure of a long-term trend. When a stock trades above it, it’s generally in an uptrend. When it trades below, it’s generally in a downtrend. (If you’re newer to trend tools, our guide to the ADX indicator is another good way to measure trend strength.) Now apply that to the whole market. What percentage of NYSE stocks are trading above their own 200-day moving average? When the index is near its highs, you’d expect a large majority of stocks to be in uptrends too, often 60% to 70% or more. If that number slips below 50% while the index keeps climbing, more than half the market is already in a downtrend. The index just isn’t showing it yet. That’s the same story the advance/decline line tells, just from a different angle. The surface looks bullish. The foundation underneath is getting weaker.Indicator 3: New Highs vs. New Lows
The third breadth indicator compares stocks hitting fresh 52-week highs to stocks hitting fresh 52-week lows. One clean way to measure it: take the number of new highs and divide it by the total of new highs plus new lows. The result always lands between 0 and 1.- A reading of 1 means every stock making an extreme is making a new high.
- A reading of 0 means every one of them is making a new low.
- A reading around 0.5 means they’re evenly split.
So What Should You Do About Weak Market Breadth?
Here’s where a lot of traders get it wrong. They see weak breadth, panic and dump everything. That’s usually a mistake. Breadth is useful information, but price still has the final say. A breadth divergence can last for months, sometimes even years, as the 1998 to 2000 example shows. If you sold the moment breadth weakened back then, you missed one of the biggest rallies in market history. The better way to think about it: weak breadth is a yellow light, not a red light. It doesn’t mean get out. It means slow down and drive more carefully. In practice, that might look like this:- Be pickier with new positions. Focus on stocks that are actually in uptrends, not ones you’re hoping will join the rally.
- Tighten up your risk. Use smaller position sizes or tighter stops so a sudden drop doesn’t hurt as much.
- Don’t fall in love with laggards. If a position has been weak while the market rose, a broader pullback could make it weaker still.
- Know your exit plan before you need it. Our guide on how to trade market tops and bottoms covers what to watch as a trend starts to turn.
How options traders can use breadth
Options give you some extra flexibility when breadth starts to weaken. Instead of selling stock you still like, you can buy protection. A debit put spread on an index ETF is a relatively low-cost way to hedge a portfolio against a pullback without giving up your upside. If you sell premium, weak breadth is a good reason to give yourself more room. Moving credit spreads further out of the money, or cutting back on size, can keep one bad week from wiping out months of gains. Our list of 28 option strategies every options trader should know covers both approaches in more detail.How Breadth Divergences Usually End
A breadth divergence can’t last forever. Eventually it gets resolved in one of two ways. Breadth catches up. The rest of the market starts participating, more stocks break above their moving averages and new highs start outnumbering new lows again. The rally gets healthier and keeps going. This happens more often than the doom-and-gloom crowd likes to admit. Price catches down. The few leaders holding up the index finally crack, and the weakness that was hiding underneath shows up in the headline numbers. That’s when a “quiet” market can turn into a sharp correction. Both outcomes have happened plenty of times, and there’s no way to know in advance which one you’ll get. That’s exactly why you keep following price while keeping an eye on breadth. You stay in the trend as long as it’s working, and you’re not caught off guard if it changes.The Bottom Line
You don’t need to track a million data points to be a successful trader. Price and trend will tell you most of what you need to know. But market breadth is one of the few indicators worth adding to your toolkit. The advance/decline line, the percentage of stocks above their 200-day moving average and the ratio of new highs to new lows all answer the same question: is the whole market moving, or just a few big names? When the answer is “just a few big names,” don’t panic. Just be more selective, manage your risk and stay alert. For more on reading the market’s daily noise without overreacting, check out how to make sense of daily market chaos.Frequently Asked Questions
What is market breadth in simple terms?
Market breadth tells you how many stocks are participating in a market move. Strong breadth means most stocks are rising with the index. Weak breadth means only a small group of stocks is driving the gains.What is a good market breadth indicator?
Three of the most popular are the advance/decline line, the percentage of stocks trading above their 200-day moving average and the ratio of new 52-week highs to new lows. Using them together gives you a clearer picture than any one alone.Is weak market breadth bearish?
It’s a caution flag, not a sell signal. Weak breadth can last a long time while the index keeps rising. It often ends with either the rest of the market catching up or the index pulling back.How is the advance/decline line calculated?
Subtract the number of declining stocks from the number of advancing stocks each day, then add that result to the previous day’s total. The running total forms the line. This article is for educational purposes only and is not investment advice. Always do your own research before making any investment decision.Market breadth tells you whether a rally has real support behind it. To learn how to turn that read into options trades with defined risk, start with our free course on trading options.