In the realm of analyzing markets, it’s often said that “Market peaks evolve gradually, while market bottoms are sudden occurrences.” This commonly used phrase suggests that the process leading to market highs tends to unfold slowly, whereas market lows tend to manifest swiftly.
When it comes to market peaks, one typically observes a sequence of declines and recoveries that don’t have a substantial impact before a significant downturn takes place. On the flip side, market bottoms are usually unmistakable, characterized by rapid events featuring significant rebounds from lows.
Let’s explore how to spot and trade market tops and bottoms across various technical scenarios. This exploration aims to provide insights into what to observe in the market and enhance your trading results.
Let’s delve into market lows first.
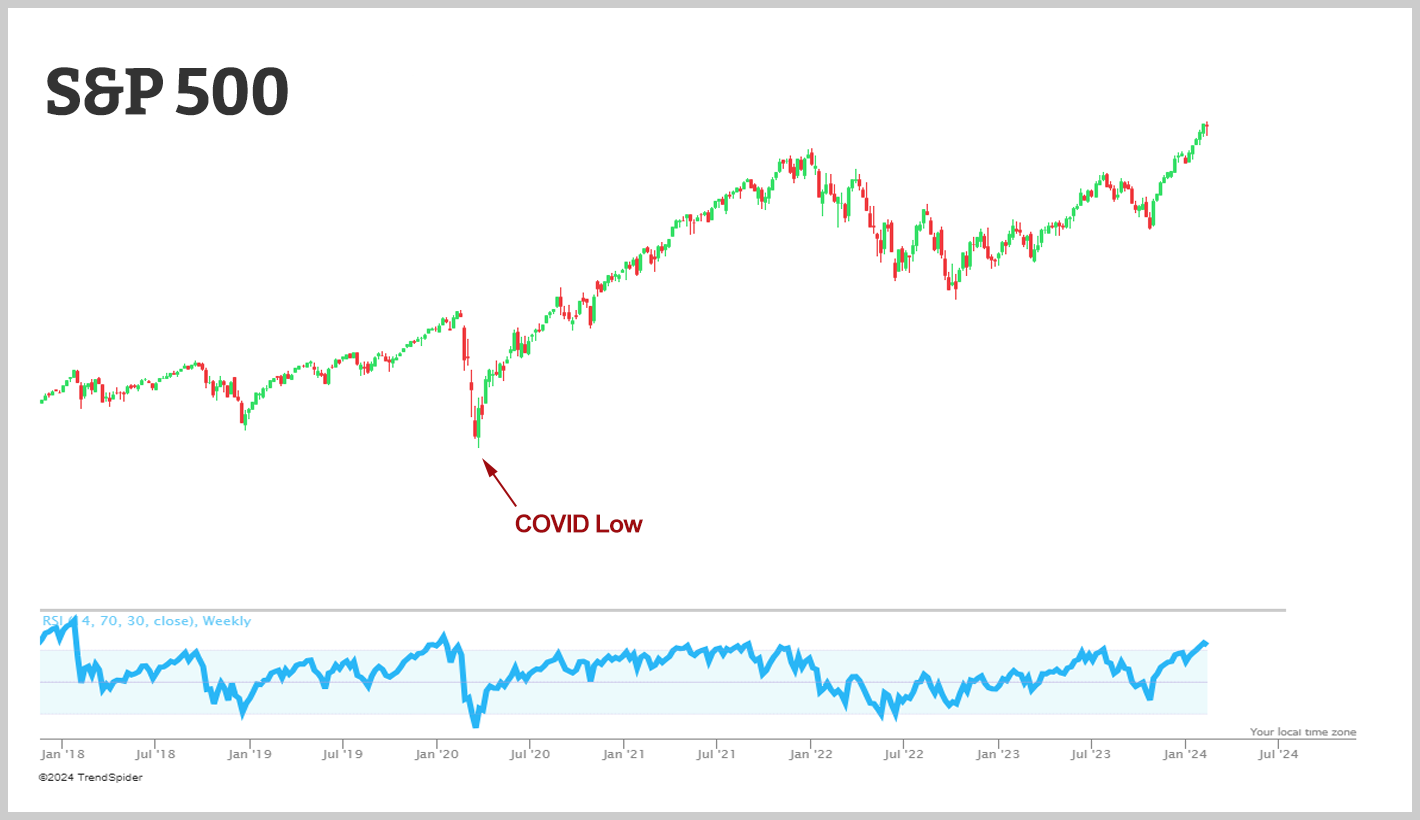
Examining the chart below reveals a distinctive V-shaped bottom and subsequent recovery in the S&P 500 Index during March 2020. This recovery occurred following the injection of trillions of dollars into the economy by the Federal Reserve in response to the market crash spurred by the COVID-19 pandemic.
Now, let’s scrutinize market peaks using the S&P 500, but over an extended period.
As previously noted, market highs typically take time to materialize. Illustrated in blue is the 2007 peak that unfolded gradually in the S&P 500 over several months. Similarly, in late 2021 and early 2022, another extended process led to a peak in the S&P 500 before substantial declines occurred.
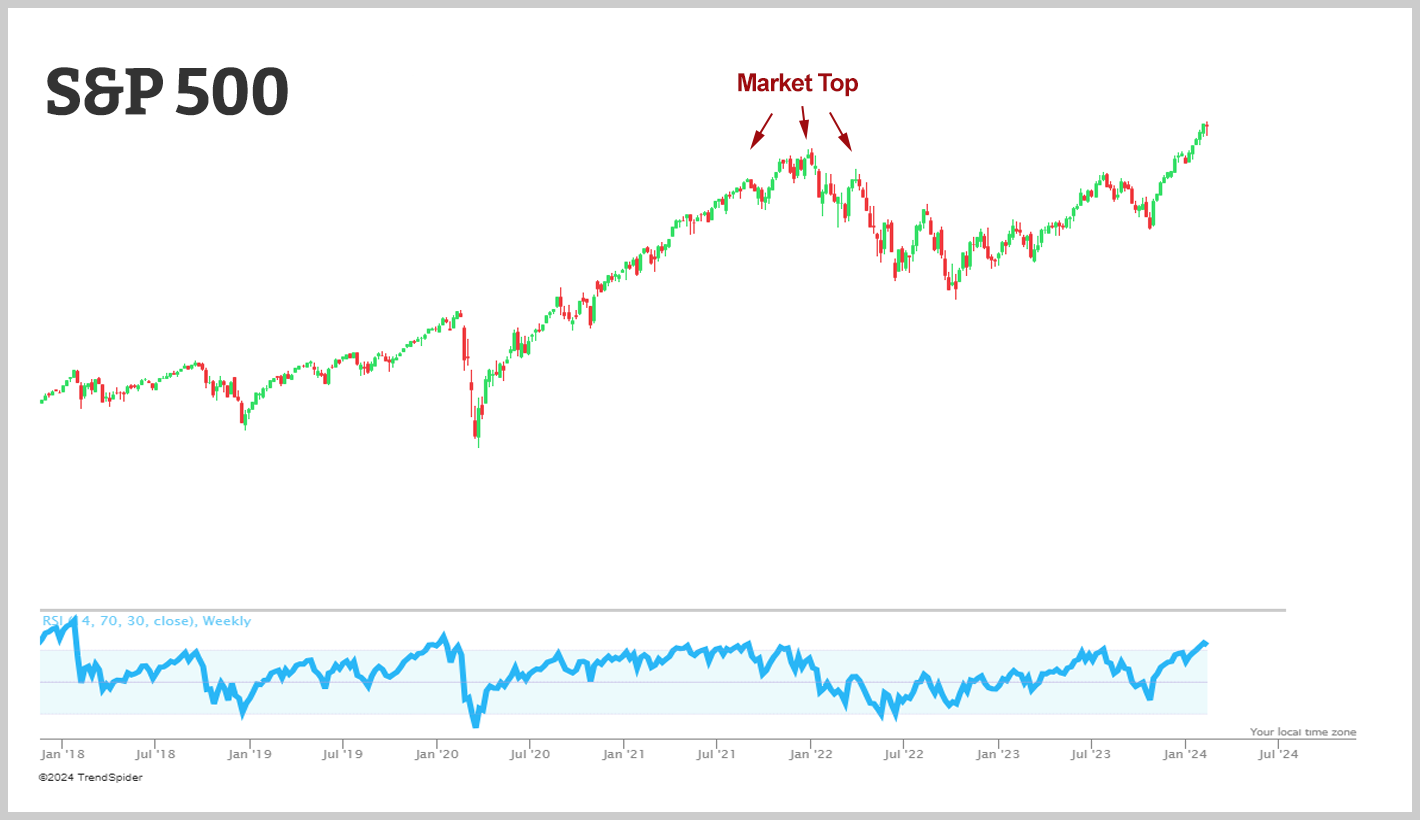
This peaking process involved an exceedingly bullish market sentiment coupled with the realization that inflation was persistent. In simple terms, inflation was not a temporary phenomenon, leading to the Federal Reserve having to raise interest rates faster than initially anticipated.
So, what did that mean for 2024?
At the start of 2024, I expected a peak resembling the ones observed in recent years. However, it’s crucial to note that each market peak is unique. Once again, market peaks require time to develop. I’m not anticipating a crash that would result in a 50% decline in the S&P 500. Nevertheless, significant market swings are expected this year.
This implies the need for a strategic trading approach, executing both bullish and bearish trades rather than relying on a broad directional bet in the market.
Signs a Market Top Is Forming
Because tops take time, they usually leave clues. Watch for these warning signs:
- Narrowing breadth. The index keeps rising, but fewer and fewer stocks are carrying it. Our guide to market breadth shows how to spot this.
- Momentum divergence. Price makes a new high, but indicators like the RSI make a lower high.
- Failed breakouts. New highs that quickly reverse back into the old range.
- Extreme optimism. Everyone is bullish, and risky stocks are rallying the most.
- Breaking trend support. The index closes below its 50-day moving average and the 50-day starts rolling over.
Signs a Market Bottom Is Forming
Bottoms are faster and more emotional. These are the signals that often show up near the low:
- Capitulation. A huge spike in selling volume as investors give up.
- Fear at extremes. The VIX jumps well above 30, and headlines turn very negative.
- A breadth thrust. After the low, a big majority of stocks rally together over just a few days.
- Positive divergence. Price makes a lower low, but momentum makes a higher low.
How to Trade Tops and Bottoms With Options
Trying to call the exact high or low is a losing game. Options let you take a position on a turning point while keeping your risk small and defined. Near a possible top, a put debit spread gives you bearish exposure for a limited cost. Near a possible bottom, a call debit spread does the same on the upside. If you’re wrong, you only lose what you paid, and you can try again when the next signal shows up.
Here’s a simple example. Say the S&P 500 has rallied for months, but breadth is shrinking and the RSI is making lower highs while the index makes new ones. Instead of shorting the market outright, you buy a put debit spread a couple of months out. If the top plays out, the spread gains value as the market falls. If the rally keeps going, your loss is capped at what you paid for the spread.
It also helps to scale in. Instead of going all in at once, start with a small position and add as the market confirms the turn. That way, a false signal costs you very little.
Whatever signals you use, write down in advance what would prove you wrong. A clear exit plan keeps one bad call from turning into a big loss.
Calling tops and bottoms is hard, but you don’t have to be perfect when your risk is defined. Our free beginner options course shows you how options let you trade turning points without betting the farm.