The symmetrical triangle pattern is relatively easy to notice because of its distinctive look. It is one of the three important triangle patterns defined by classical technical analysis. The other two being the descending triangle and the ascending triangle.
The symmetrical triangle is a chart that can be recognized by its lower highs and higher lows. When two trend lines converge with the converging trend lines connecting and containing several peaks and troughs, then this pattern is indicated.
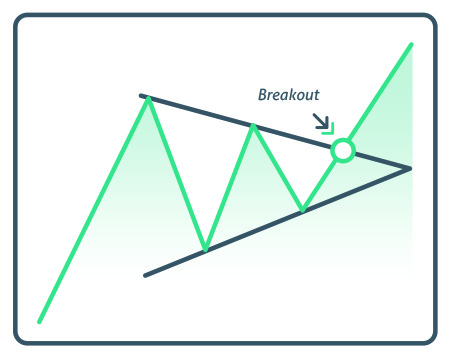
Once one of those peaks “break out” of this barrier, it can indicate a powerful bullish or bearish movement that investors can take advantage of if they know how to look for it. If the breakout point is manifested at a trough point, this can indicate a strong movement into bear territory and an excellent indication that it is time to get out. If the breakout point is at a peak, this can indicate a bull movement and a good time to invest.
Edwards and Magee, the authors of Technical Analysis of Stock Trends, suggest that roughly 75% of symmetrical triangles are continuation patterns and the rest mark reversals.
The duration of these patterns can vary greatly and quite frequently, large patterns whose momentum dies out because investors are unsure of which way the market will react.
This indicates we should not anticipate the direction of the breakout, but instead be patient and wait for the happen. Additional analysis may also be applied to the breakout by looking at gaps, volume, and accelerated price movement. When trading the symmetrical triangle, it is critical to wait for a confirmation to be on the right side of the breakout.
These patterns contain two or more swing highs and lows when it comes to price, and investors need to prepare to adjust trend lines with more “swings” to level the playing field. These types of patters can often confuse investors, and they lose volume because they appear to be “aimless,” but for those who know how to look for the breakouts, these patterns can give a great indication of when it buy-in and when to get out.
How to Trade a Symmetrical Triangles
A systematical triangle may be setting up for a breakout which can be calculated by taking the distance from the upper support line and the lower resistance at the start of the pattern and then add that to the breakout price point. For example, the systematical triangle may begin with a price point of $40, then trade up to $50 before the trading range starts to narrow. So here, a breakout from a $45 price point would likely result in a price target of $55 ($50 – $40 = $10 + $45 = $55).
A stop loss order for the symmetrical triangle pattern should be placed slightly below the breakout point. For example, if the stock starts to break out from $45 on above-average volume, the investors should place his stop loss order slightly below the $45 price point.
Why Do Symmetrical Triangles Happen
When supply and demand fall out of equilibrium, the price action of the stock will move. Either the bulls will overtake the bears and pushed the stock higher, or the bears will overtake the bulls and pushed the stock lower—the traders who can accurately identify which direction the symmetrical triangle will brief the rewards of profit.
Attributes
- Pattern type: Continuation or reversal
- Indication: Bullish or bearish
- Breakout confirmation: The confirmation for this pattern is a close above or below the converging trend lines on above-average trading volume.
- Measuring: subtract the height of the lowest low and the highest high of the pattern and then add or subtract this amount to the breakout level depending on which way the breakout moves.
- Volume: The volume declines throughout the ssymmetrical triangle formation, expanding on the breakout.
Conclusion
Be careful trading the symmetrical triangle, as traders may be faked out on bullish and bearish signals that reverse shortly after the trend starts. It is recommended to hold off for a day after the breakout to determine if the pattern is real or not. Look for a one-day closing price target below the trend line for a bullish signal and above the trend line for a bearish signal. To learn more about stock chart patterns and how to take advantage of technical analysis to the fullest, be sure to check out our entire library of predictable chart patterns. These include comprehensive descriptions and images so that you can recognize important chart patterns scenarios and become a better trader.