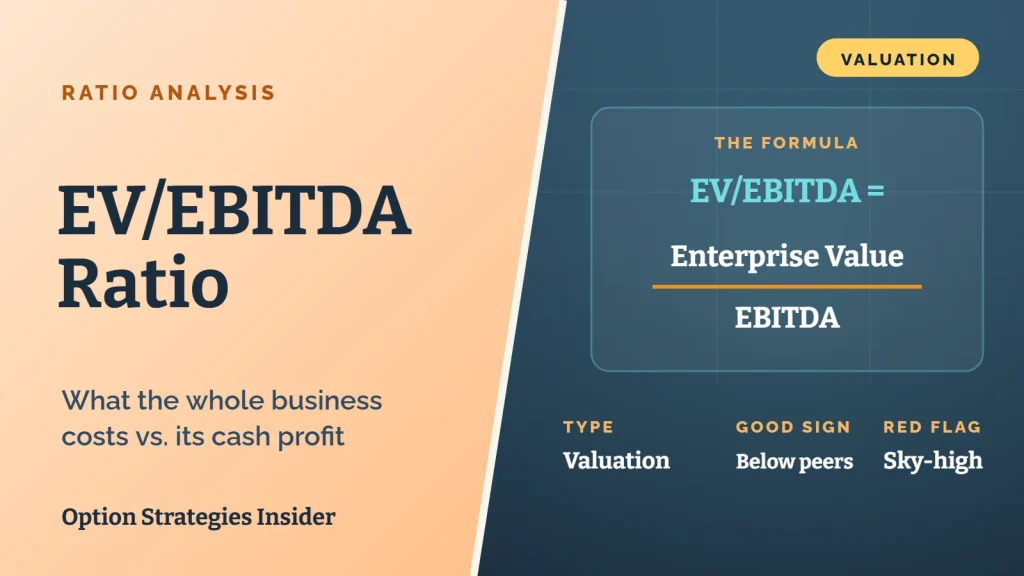
The Enterprise Value (EV) to its Earnings Before Interest, Taxes, Depreciation & Amortization (EBITDA) ratio or EV/EBITDA ratio is a common metric utilized as a value tool that relates value of the organization along with short term and long term debt, cash expenses, and the cash earnings without non-revenue based costs. It would be ideal for investors and analysts to search for firms within a similar industry.
Enterprise Value or EV is a valuable tool as it measures a company’s worth. The ratio is preferred to other measuring tools because it also includes Market Value of Debt and Minority Interest. EBITDA, on the other hand, is a tool used to calculate a company’s operating performance. It’s commonly seen as a means for understanding a company’s operating cash flow.
The EV to EBITDA multiple is assessed by dividing EV by the earnings before interests, taxes, depreciation, and amortization. Usually, the values of EV/EBITDA below ten are noted to be healthy. In investment banking, it’s important to compare values between similar companies in order to determine which companies are the healthiest within the sector.
Also known as an enterprise multiple, the EV/EBITDA ratio considers a companies value and displays it in a way that would make sense to a buyer through assessing debt.
Formula
The formula and calculation is determined as EV/EBITDA
Where EV = Market Capitalization + Total Debt – Cash and Cash Equivalents
What the Enterprise Multiple Informs
Investors can use the EV/EBITDA ratio to assess if the stock price is being valued the right way. Low ratios relative to the historical industry averages mean the company is being undervalued, though high ratios would mean being overvalued.
The enterprise multiple is also good for international comparisons as it is not affected by the individual taxational policies of different countries. It may be used to find takeover candidates, which are attractive because enterprise value includes long term debt, and it is a better metric than the market cap for mergers and acquisitions.
Benefits of EV/EBITDA
The ratio is similar to the Price-to-Earnings ratio, which takes a closer look at earnings per share, because a low value means an undervaluation for the company. It is advantageous to use the EV/EBITDA ratio alongside the Price-to-Earnings. Investors may look for companies with a low business valuation metric using the P/E and EV/EBITDA, not to mention potential dividends. The ratio is also used to compare a company against a competitor of relative values when it comes to different enterprises.
Limitations of EV Multiple
The valuation multiple is not usually right for comparing the balance sheet of firms within different nations because capital structure requirements are not the same. The ratio may work around the taxation policies, but it might not provide reliable conclusions when comparing different industries. The metric is popular for attractive buyouts.
However, there is potential for value traps. These are stocks that have low multiples as they are deserved. It brings the illusion of value investment; however, the company’s fundamentals could be saying there will be negative returns.
It is assumed that the past performance shows the future returns, and when the multiple reduces, investors may capitalize on buying it because they believe it is undervalued. Knowledge concerning the industry and the particular company ratios would help in evaluating the true values.
One great way of doing this would be to consider profitability and determine if the projections are valid. Value traps happen when the profitability estimates seem to be cheap, but the reality is the EBITDA is too high, and the stock has already plummeted.
EV/EBITDA Example
Say a company has an $8 billion market cap, $2 billion in debt and $1 billion in cash. Its enterprise value is $8 billion plus $2 billion minus $1 billion, or $9 billion. If its EBITDA is $1 billion, its EV/EBITDA multiple is 9. You’d be paying 9 times yearly EBITDA to buy the whole company, debt included.
What Is a Good EV/EBITDA Ratio?
It varies by industry and market conditions. Many investors see multiples under about 10 as reasonable for mature companies, while fast-growing tech companies often trade much higher. The most useful comparison is against direct competitors and the company’s own history.
EV/EBITDA vs. P/E Ratio
The P/E ratio only looks at the stock price and net earnings, so it’s affected by how much debt a company carries and its tax situation. EV/EBITDA includes debt and cash and looks at earnings before interest, taxes, depreciation and amortization. That makes it easier to compare companies with very different balance sheets, which is why it’s popular in buyouts and mergers.
EV/EBITDA FAQ
What does a high EV/EBITDA mean? The market is paying a lot relative to current cash earnings, often because it expects strong growth. It can also mean the stock is overvalued.
What’s a weakness of EV/EBITDA? EBITDA ignores capital spending, so companies that need heavy ongoing investment can look cheaper than they really are. EV to free cash flow addresses that.
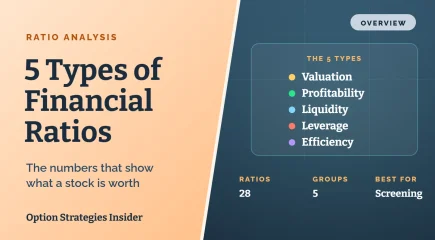
Where can I learn more ratios? See our guide to the 5 types of financial ratios.
The Right Option Strategy for Accelerated Growth
Finding the right option strategy to fit your specific needs is often difficult for new traders, stop playing the guessing game and get instant access to top-level market research coupled with the perfect options strategy. See firsthand how professional traders combined ratios, fundamental, and technical indicators to make above-average returns. If you’re ready to take your trading to the next level, we can help you achieve your goals, click here to get started now.
Related Financial Ratios
- EV to Free Cash Flow: value compared to free cash flow
- P/E Ratio: what you pay for $1 of earnings
- Leverage Ratios: the full set of debt measures
- All 28 Financial Ratios: the full guide, grouped by type