Technical analysis is one of the best tools traders can use to spot shifts within the market, allowing them to predict support and resistance levels within a predictable timeframe.
There are many different continuation and reversal patterns to look out for when reading the stock charts. This list of 17 chart patterns are essential, and knowing them will give an investor a trading edge, so it pays to keep these close. Looking for these chart patterns every day, studying the charts will allow the trader to learn and recognize technical trading strategies in the data and the implications that these patterns imply.
Click the desired chart to get full details on how technical traders use them.
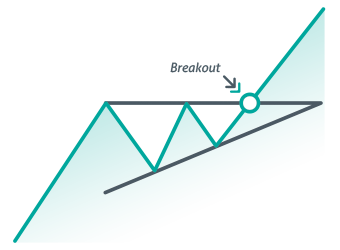
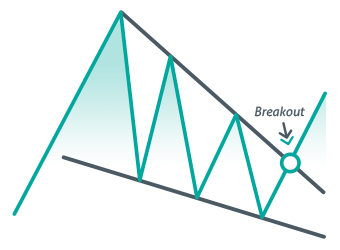
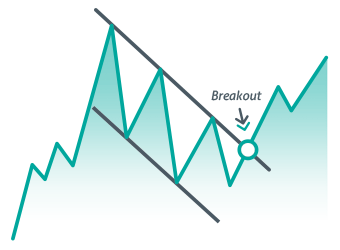
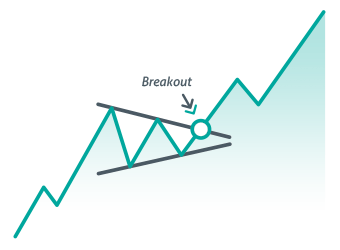
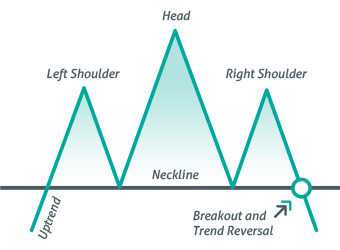

Traders who use technical analysis study chart patterns to analyze stocks or indexes price action in accordance with the shape chart creates. By understanding the trends, a trader can confirm an accurate short-term price movement. For example, if the chart represents an ascending triangle, the price will continue to bounce off the trendlines until the convergence, where the price breaks out to the upside. Each pattern has its own set of rules and strategies to interpret. The 17 chart patterns listed in this resource are one’s technical traders can turn to over and over again, allowing them to take advantage trend reversals and future price movement.
Get Ahead of the Curve
Stock chart patterns, when identified correctly, can be used to identify a consolidation in the market, often leading to a likely continuation or reversal trend. Traders may use these trendlines to forecast price patterns that can be traded for profit.