
The Relative Strength Index (RSI) is a tool used to gauge the momentum of price movements. It operates on a scale from zero to 100, indicating the speed and extent of price changes. As per J. Welles Wilder, the creator of RSI, a stock is deemed overbought when its RSI surpasses 70, while it is considered oversold when the RSI falls below 30.
While RSI values alone can provide useful insights for trading, combining multiple RSI points to develop trading strategies significantly enhances the value of the data. This approach increases the likelihood of identifying reversals or divergences. Additionally, you can employ other indicators alongside the RSI indicator to further enhance your trading endeavors.
What is Technical Analysis?
Before we delve into the most effective strategies for utilizing the RSI indicator in trading, it’s important to cover some fundamental aspects. Technical analysis is a method of forecasting price movements and future market trends by examining charts displaying past market activity and comparing them to present ones. Technical analysis focuses on understanding the actual occurrences in the market and anticipating potential outcomes.
This approach considers the prices of various instruments and utilizes charts created from this data as the primary tool.
The greatest advantage of technical analysis is that seasoned traders can monitor multiple markets and instruments simultaneously, assessing various factors for each market. Subsequently, they can execute trades with a high likelihood of success based on the gathered data.
Overbought and Oversold Conditions
Take a look at the chart below, which represents the daily activity of Apple (AAPL). It’s quite evident that AAPL became excessively overbought, reaching an RSI of 76 in August, which signaled a possible decline was imminent. Apple shares also experienced overbought conditions again in February, registering an RSI of 74, and shortly after, the stock indeed fell. The same thing happened yet again in April.
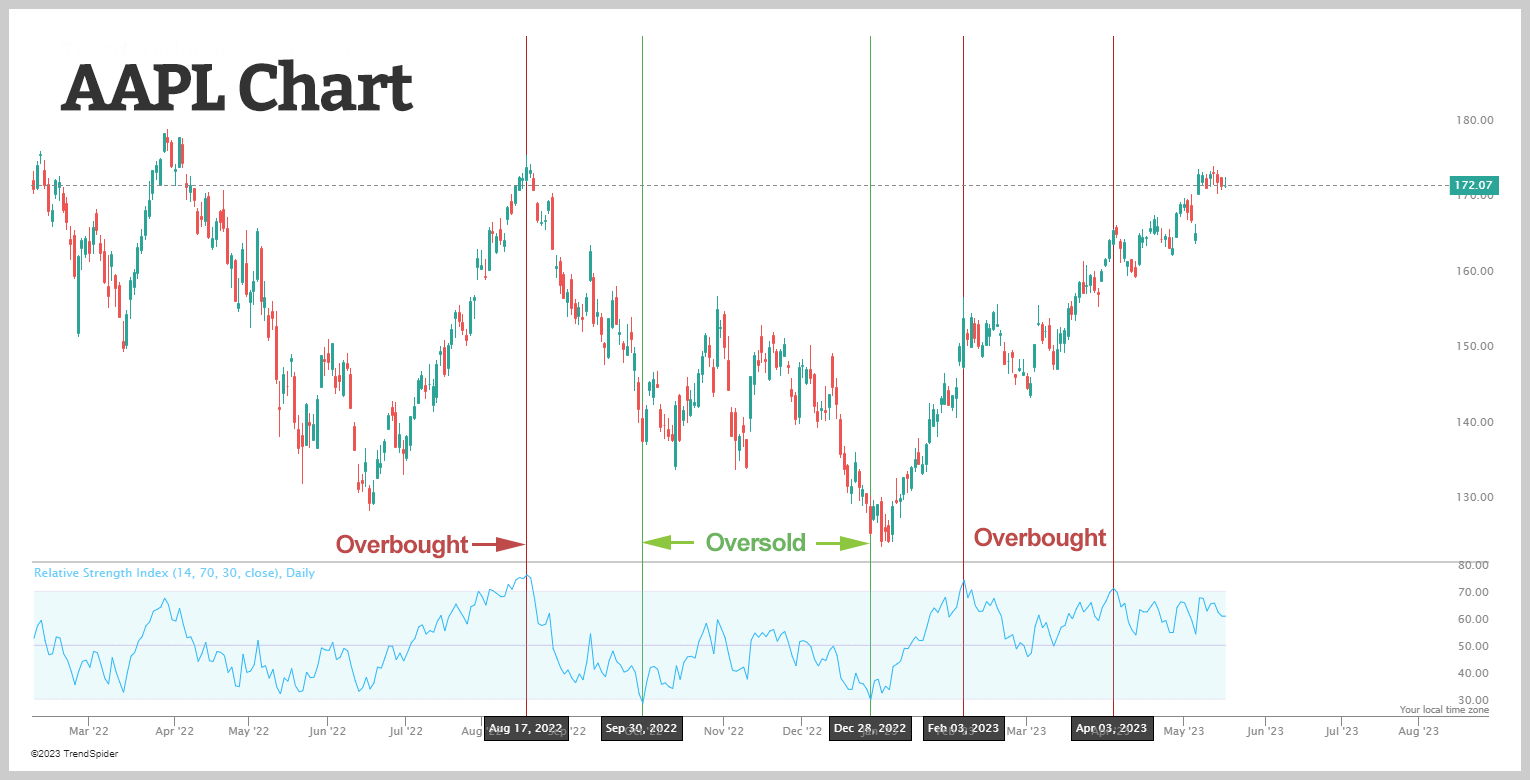
You can also see the stock reached an oversold state in late September with an RSI of 29. It then became oversold once more in late December, hitting a 30 RSI. It’s worth noting that in both cases, the stock experienced a rally shortly thereafter. However, it’s important to understand that reaching oversold conditions does not necessarily mean an immediate rally is soon to follow. It can take days or perhaps weeks in some cases.
Despite being oversold, Apple didn’t rally right away in either case. Instead, it traded even lower for a few days before resuming an upward trajectory with a strong rally. This shows that momentum oscillators have the potential to remain overbought (or oversold) during a robust upward (or downward) trend.
Positive and Negative RSI Reversals
Andrew Cardwell introduced the concept of positive and negative reversals in relation to RSI. According to Cardwell, bearish RSI divergences are more likely to occur during bull markets, indicating a potential upward trend. Conversely, bullish RSI divergences are considered indicative of a downtrend in bear markets.
A positive reversal takes place when RSI forms a lower low while the security forms a higher low. This lower low typically falls between the range of 30 and 50, rather than reaching oversold levels. In the chart below, Microsoft (MSFT) demonstrates a positive reversal formation in November. Several weeks later, MSFT broke through resistance, causing RSI to reach 70. Despite exhibiting weaker momentum with a lower low in RSI, MSFT’s price remained above its previous low, indicating underlying strength. Essentially, the price movement overrode the momentum, leading to a rally in the stock.

Conversely, a negative RSI reversal is the opposite of a positive reversal. In this case, RSI forms a higher high while security forms a lower high. Similar to the positive RSI reversal, the higher high usually occurs just below overbought levels, typically within the range of 50-70.
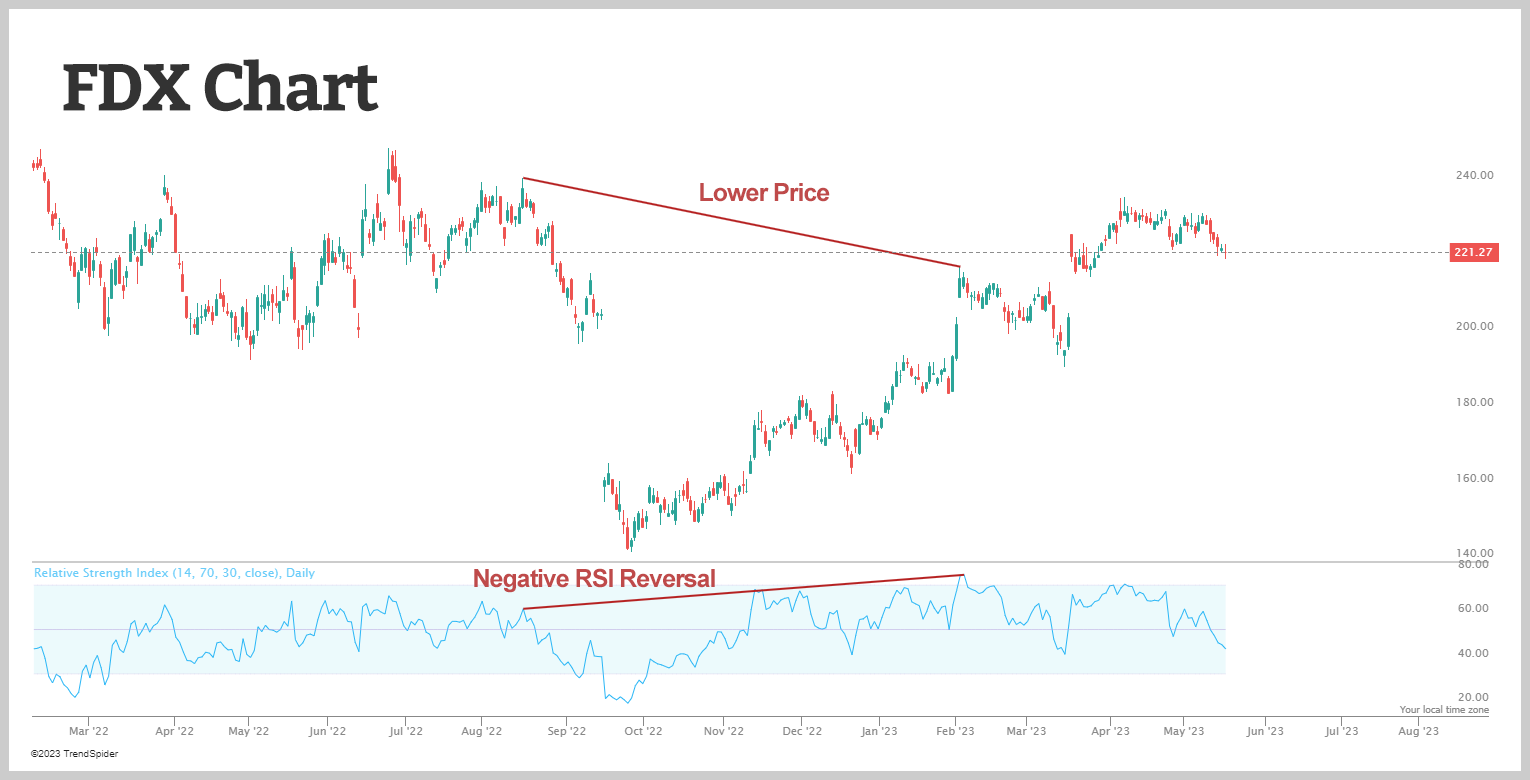
The following chart FedEx Corp (FDX) forms a lower high as RSI forms a higher high. Although RSI achieved a new high and exhibited strong momentum, the price action failed to confirm this with a lower high formation. This negative reversal served as a warning sign before the significant support break in early February, which resulted in the stock dropping $25 over the next six weeks.
RSI Divergence
Divergences indicate a potential turning point because the direction of momentum does not align with the price movement. A bullish RSI divergence occurs when the underlying security reaches a lower low while RSI forms a higher low. This discrepancy suggests strengthening momentum. On the other hand, a bearish RSI divergence occurs when the security achieves a higher high and RSI forms a lower high. This indicates weakening momentum as RSI fails to confirm the new high.
In the chart below, we can observe a bullish RSI divergence in the case of Apple (AAPL) from October to November. Despite AAPL reaching new lows in October, RSI remained above its previous low, reflecting reduced downside momentum during the decline. The breakout in November confirmed the improvement in momentum.
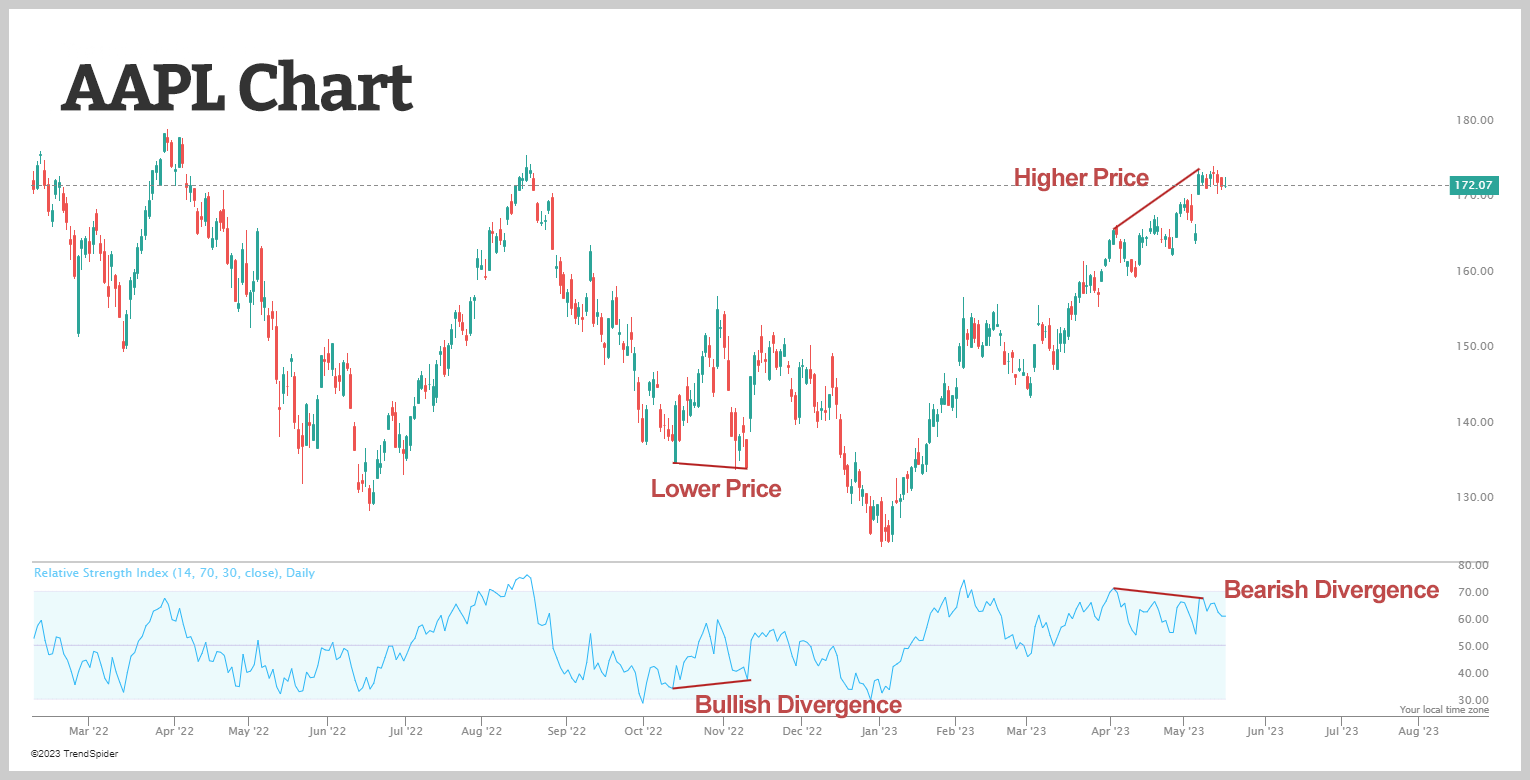
Similarly, on the same chart, we can also identify a bearish RSI divergence occurring from April to May. Although the stock made new highs, RSI formed lower highs, signaling a bearish RSI divergence. Subsequently, a breakdown followed, confirming the weakening momentum.
It’s worth noting that divergences are more reliable when they emerge after an overbought or oversold reading. However, it’s important to exercise caution when relying solely on divergences, as strong trends can exhibit multiple bearish divergences before an actual top is formed. Likewise, bullish RSI divergences can appear in a strong downtrend without leading to a significant reversal. The chart below displays Nvidia (NVDA) with two bearish RSI divergences alongside an ongoing uptrend. Although these divergences may have indicated a short-term pullback, there was no evident major trend reversal.

RSI Failure Swings
Failure swings are strong signals indicating an upcoming reversal. They rely solely on RSI for indications and do not consider price action or divergences.
A bullish failure swing occurs when RSI drops below 30 (indicating oversold conditions), rebounds above 30, experiences a minor decline, but remains above 30, and eventually surpasses its previous high. This sequence involves reaching oversold levels and forming a higher low above those levels.
The chart below illustrates Alibaba (BABA) forming a bullish failure swing. After the RSI failure swing, BABA stock witnessed a significant rally.

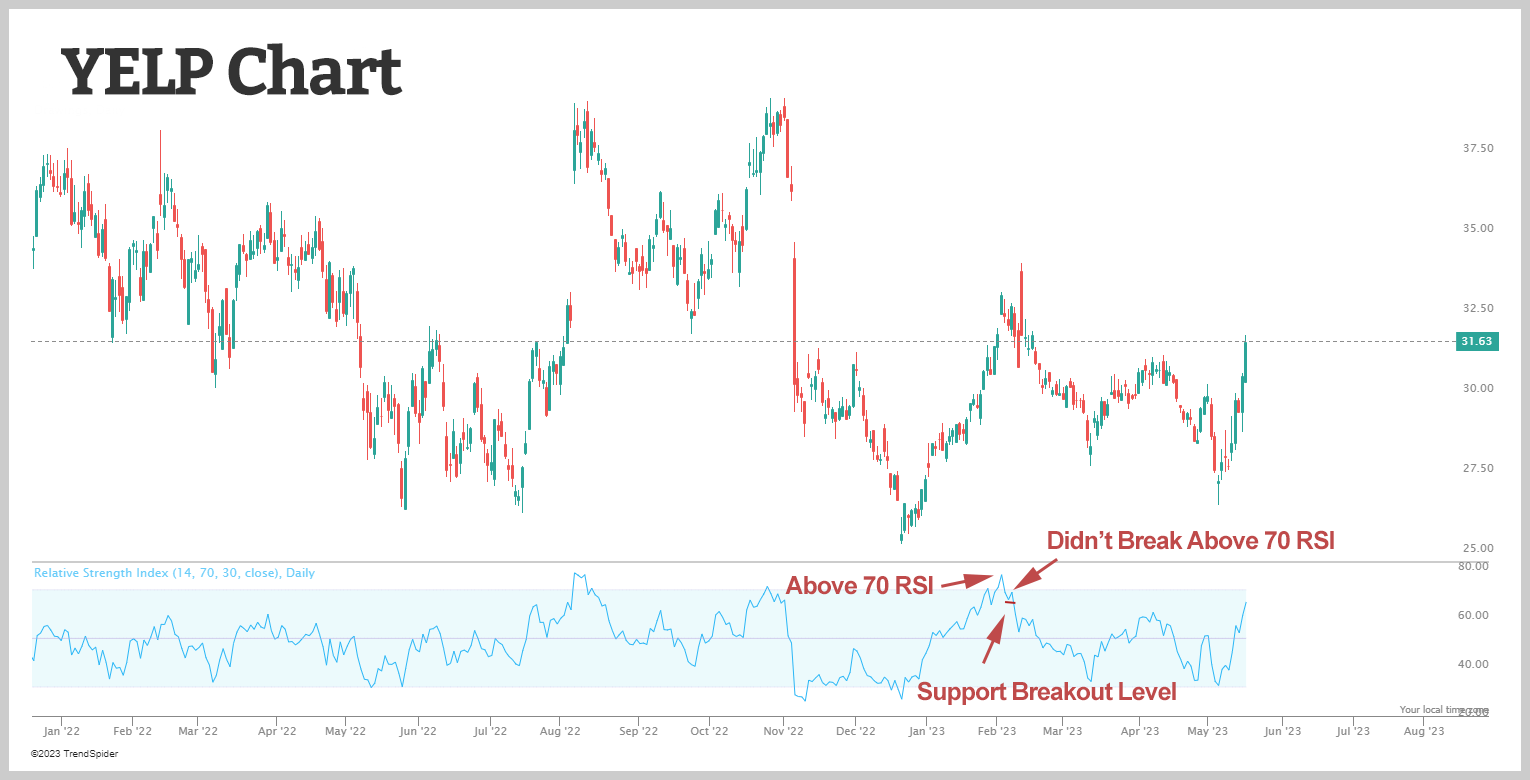
On the other hand, a bearish failure swing takes place when RSI rises above 70, retraces, bounces, fails to exceed 70 again, and subsequently breaks its prior low. Essentially, it involves reaching overbought levels, followed by a lower high below those levels. The chart of Yelp Inc. (YELP) demonstrates an instance of a bearish RSI failure swing, which preceded a decline in the stock.
Wrap Up
RSI is a versatile momentum oscillator that has proven its effectiveness over time. Despite changes in market conditions and volatility, RSI remains just as relevant today as it was in its early days. While Wilder’s original interpretations provide valuable insights into the indicator, the work of Cardwell takes RSI interpretation to a new level.
Adapting to this advanced level of understanding requires some reevaluation for chartists who follow traditional methods. Wilder views overbought conditions as potential reversal points, but it’s important to note that overbought levels can also indicate strength in certain cases.
Bearish RSI divergences still offer valuable sell signals, but it’s crucial for chartists to exercise caution during strong trends, as bearish divergences may be a normal occurrence.
Positive and negative reversals prioritize the price action of the underlying security over the indicator itself, which is the way it should be. In contrast, bearish and bullish divergences place more emphasis on the indicator than the price action. By focusing more on price action, the concept of positive and negative reversals challenges our conventional understanding of momentum oscillators.
If you want to use these strategies and many other trading strategies, join our community of traders who can offer guidance and support. Join now for free and get instant access to our award-winning options trading course, which explains exactly how options work and which strategies should be applied in any given situation. When it comes to trading, don’t play defense. Instead, have a plan, spot the changes, and execute an offense of strategy to grow your portfolio to new levels. Click here to get started.