The financial world is filled with indicators and tools designed to assist traders in making informed decisions. Among these tools is the Average Directional Index (ADX), along with its companions, the Minus Directional Indicator (-DI) and Plus Directional Indicator (+DI).
These indicators are part of a trading system created by Welles Wilder. While initially intended for commodities and daily price movements, these indicators can also be applied to the world of stocks.
At the heart of the Directional Movement System, which Welles Wilder devised, are the concepts of positive and negative directional movement. Wilder’s ingenious approach involved comparing the difference between two consecutive lows with the difference between their corresponding highs to determine directional movement.
The Plus Directional Indicator (+DI) and the Minus Directional Indicator (-DI) are derived from these differences. These indicators represent smoothed averages of these differences and serve as instruments for gauging the trend’s direction over time.
Collectively, they are often referred to as the Directional Movement Indicator (DMI).
The Average Directional Index (ADX) is another significant component of this system. It is derived from the smoothed averages of the disparity between +DI and -DI. Essentially, the ADX measures the trend’s strength over time, regardless of its specific direction.
By employing these three indicators in tandem, traders can effectively determine both the direction and strength of the prevailing trend.
Reading the Average Directional Index (ADX) Indicator
By default, the main ADX line is in black, the Plus Directional Indicator (+DI) in green, and the Minus Directional Indicator (-DI) in red.
This color scheme makes it intuitive to spot crosses between these directional indicators. While ADX can be placed above, below, or behind the main price plot, it is advisable to position it above or below because it involves three distinct lines. To facilitate the identification of ADX movements, you can also include a horizontal line on the chart.
The illustrative chart below shows the simultaneous presence of the 50-day Simple Moving Average (SMA) in light blue and the Parabolic SAR indicator in dark blue. The moving average serves as a filter for signals, with buy signals exclusively considered when trading occurs above the 50-day moving average.
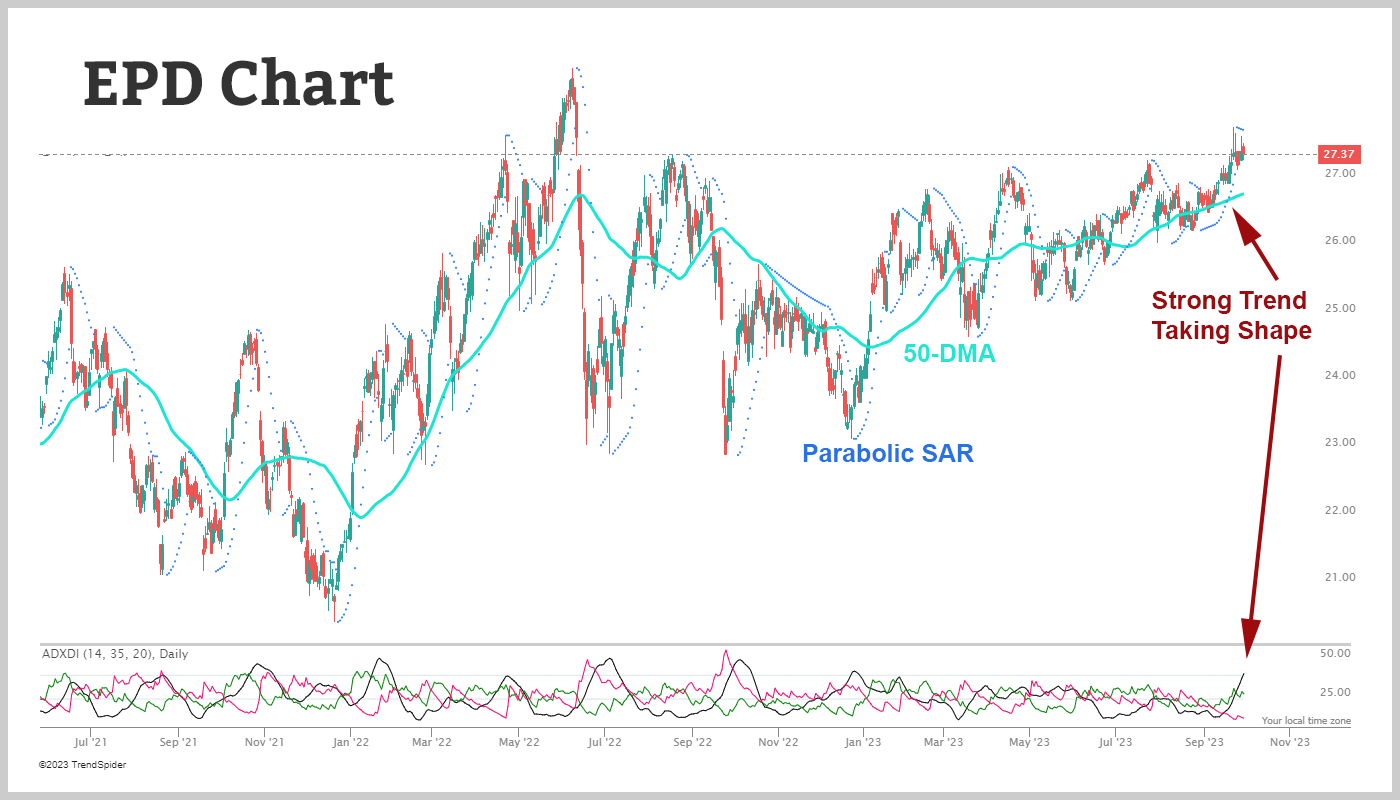
Following initiation, the Parabolic SAR can effectively set stop-loss orders. The above chart shows that the price action has moved above the 50-day Simple Moving Average, while the ADX has indicated a strong bullish trend. Here, we could initiate a bullish trade and set our stop-loss level indicated by the Parabolic SAR.
Trading with the Average Directional Index (ADX)
When engaging in trading, understanding the strength of a trend, regardless of its direction, can be invaluable. To assess the strength of a trend, traders often turn to the Average Directional Index, or ADX, which serves as a widely-used technical indicator for this very purpose.
The ADX, classified as an oscillator, fluctuates between 0 and 100. Readings below 20 suggest a weak trend, while those above 40 indicate a strong trend. Though the calculation of ADX can be intricate, its core principle is relatively straightforward: the stronger the trend, the higher the ADX reading.
Low ADX values spotlight periods when prices generally move sideways or remain within a range. Conversely, when the ADX surpasses the 40 mark, it signals that prices have gained significant momentum in one direction.
It’s crucial to note that ADX does not determine whether the trend is bullish (upward) or bearish (downward). Instead, it measures the strength of the current trend. As a result, ADX is typically employed to identify whether the market is in a ranging phase or initiating a new trend. It is considered a “non-directional” indicator since it relies on comparing the highs and lows of price bars, omitting consideration of the bar’s closing price.
In essence, the magnitude of the ADX reading increases with the strength of the trend, regardless of whether it is an uptrend or downtrend.
Practical Application of ADX
When utilizing the ADX indicator, it is crucial to monitor key levels, particularly the 20 and 40 thresholds. These levels can provide valuable insights into market conditions. Here’s a simplified reference guide for interpreting ADX values:
- Rising ADX: Signifies a strengthening trend.
- Falling ADX: Suggests a weakening trend.
- ADX below 20: Indicates a weak trend.
- ADX between 20 and 40: Points to a strong trend.
- ADX above 40: Represents an extreme trend.
Let’s illustrate these concepts with a couple of examples.
Example 1
First, let’s take a look at the I VanEck Semiconductor ETF (SMH):
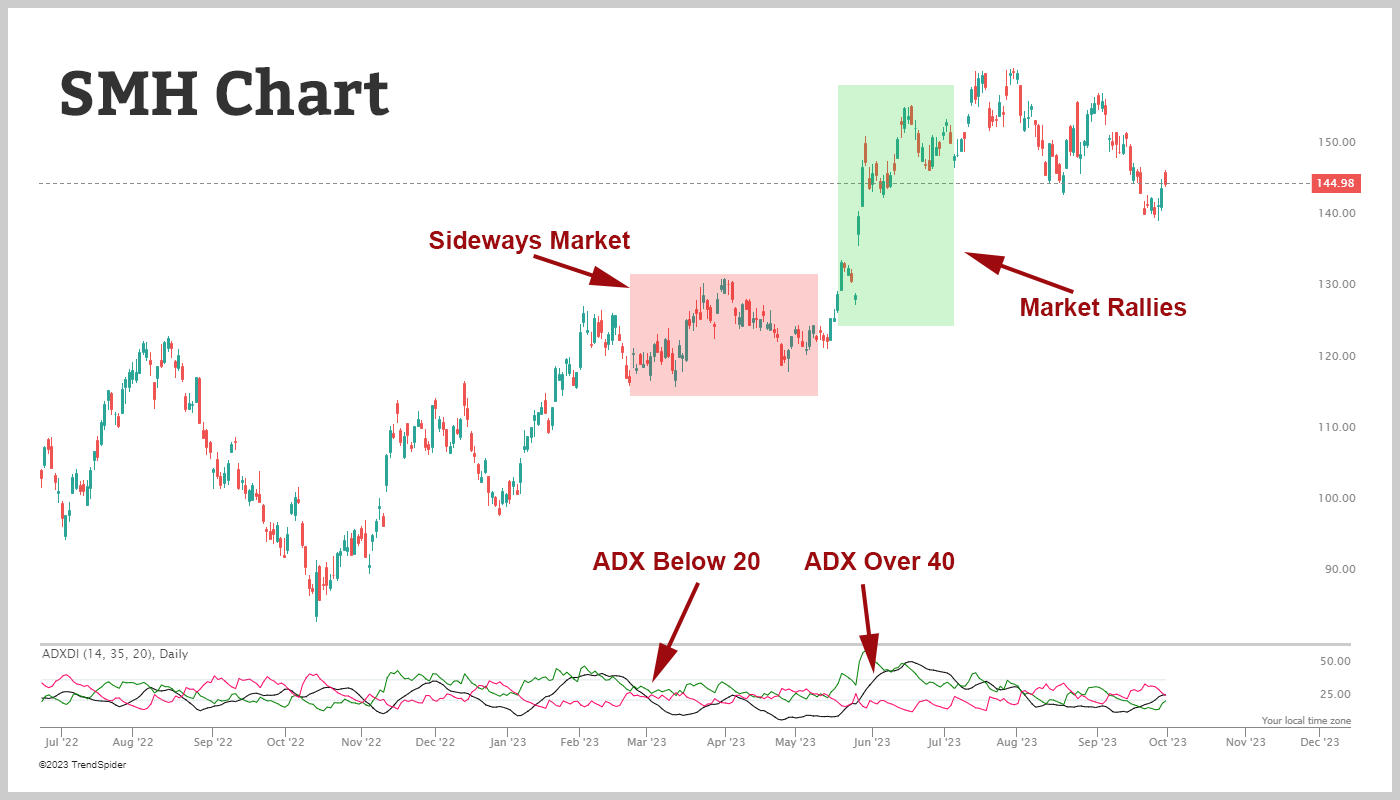
For an extended period from Late February to late May, the ADX remained below 20. During this time, the SMH exhibited a sideways trading pattern.
However, after that, in June, the ADX began to rise above 40, signaling the emergence of a strong trend. Consequently, SMH rallied, embarking on a significant up trend, yielding significant profits for its investors.
Example 2
Here is SPDR Select Industrial Sector Fund (XLI):
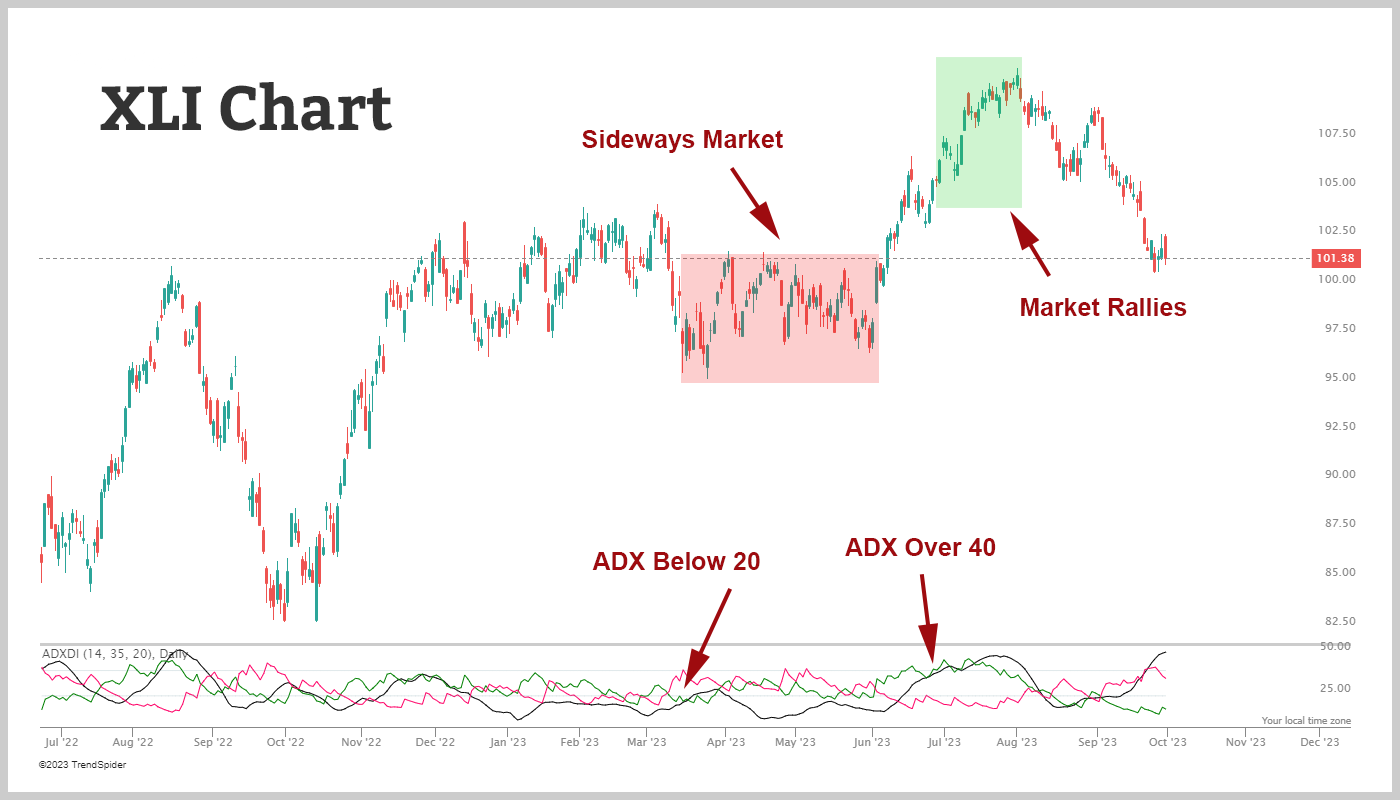
In a scenario similar to the first example, the ADX remained below 20 for an extended period, accompanied by sideways movement. Eventually, the ADX surged above 40, coinciding with XLI breaking out to new highs. This marked the onset of a robust uptrend, generating a profit of for long investors.
While the application of ADX appears straightforward, it’s essential to recognize that it doesn’t provide specific buy or sell signals. Instead, it aids in determining whether it’s opportune to participate in an ongoing trend.
When the ADX starts to decline below 40, it suggests that the current trend is losing momentum, potentially paving the way for sideways price movement. At this juncture, locking in profits may be a prudent move.
Option Trading Strategies
The ADX indicator is crucial in assisting traders in selecting the most suitable option strategy based on prevailing market conditions.
Combined with a low ADX indicator, the iron condor option strategy emerges as an advantageous choice. In low ADX environments, the market typically exhibits minimal directional strength and often remains range-bound. This scenario aligns perfectly with the iron condor strategy, which thrives in stable markets characterized by limited price movements.
The iron condor involves simultaneously selling out-of-the-money call and put options while buying further out-of-the-money call and put options to define risk.
This strategy generates a net credit and excels when transitioning from high-volatility to low-volatility time periods. When the ADX is low, it signifies a lack of trending solid behavior, reducing the likelihood of the underlying asset breaking out of the established trading range.
Consequently, the iron condor has a higher probability of reaching its maximum profit potential, which is the net credit received when the options expire worthless.
Conversely, when the ADX indicator reaches elevated levels, it signals heightened directional momentum and increased market volatility. During such periods, more aggressive momentum-based option trading strategies become appropriate.
These strategies involve buying options to capitalize on significant price swings, which align with the market’s newfound momentum. Traders can explore opportunities that cater to larger price fluctuations, utilizing options like long calls or puts or employing strategies such as bull call spreads or bear put spreads.
The elevated ADX indicates that the market is in a dynamic state, prompting traders to adapt their approach and seek strategies that align with the heightened volatility and momentum, potentially leading to larger profit potential.
Wrap Up
The ADX indicator can be a valuable tool for traders. By understanding the strength of a trend, traders can make more informed decisions regarding their trading option strategies. Remember, the trend may be your friend, but ADX helps you identify when to reevaluate that friendship.
We invite you to explore our free options trading course to dive deeper into the world of trading indicators and, harness the full potential of price fluctuations and how to apply the appropriate strategies to take advantage of any given situation. This course provides in-depth insights with detailed explanations and visual aids, enabling you to identify crucial chart patterns and scenarios. Get our free course to enhance your trading skills quickly and become a more proficient trader.