The Stochastic Oscillator, created by George C. Lane in the late 1950s, is a tool revealing the pace and force of price shifts. Instead of tracking price or volume, it assesses price momentum. In simple terms, it predicts momentum changes before prices do, which is now windely accepted due to its ability to provide valuable insights into market trends and potential price reversals.
The Stochastic indicator is a momentum oscillator that compares an asset’s closing price to its price range over a given period. It consists of two lines, the %K and the %D – which oscillate between 0 and 100 on a chart. The %K line represents the current closing price relative to the high-low range, while the %D line is a smoothed version of the %K line. These lines help identify overbought and oversold conditions in a market.
To calculate the Stochastic Indicator, we need three key variables: the highest high (HH), lowest low (LL), and closing price (CP). The formula looks like this:
- %K = (CP – LL) / (HH – LL) * 100
- %D = Simple Moving Average (%K)
Let’s explore the actual uses of this indication and some tips for integrating it into your trading routine now that we have a fundamental understanding of how it operates.
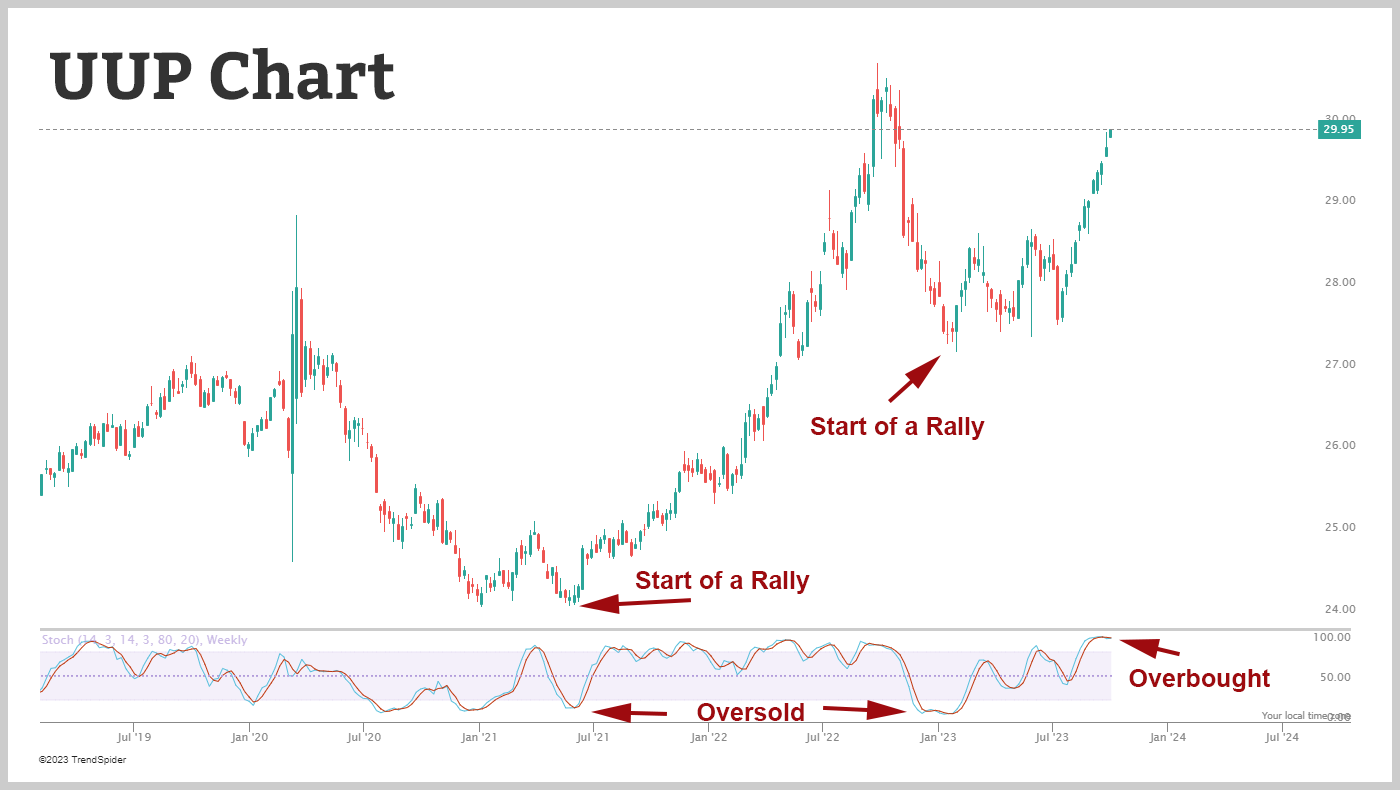
Recognizing Conditions of Overbought and Oversold Status
The Stochastic Indicator is frequently used to spot overbought and oversold market conditions. A probable price reversal or downtrend is suggested when both the %K and %D lines are over 80, indicating that an asset is overbought. On the other hand, when both lines drop below 20, it denotes an oversold situation with potential price movement.
Combining these indications with other technical analysis techniques can be beneficial in confirming a likely trend reversal. But it’s crucial to keep in mind that overbought and oversold conditions do not necessarily guarantee an immediate price reversal.
Recognizing Bullish and Bearish Divergences
The Stochastic Indicator also has the potential to spot bullish and bearish divergences. When prices make lower lows and the Stochastic Indicator makes higher lows, this is referred to as a bullish divergence. This implies that the selling pressure is easing and that a possible positive reversal may be just around the corner.
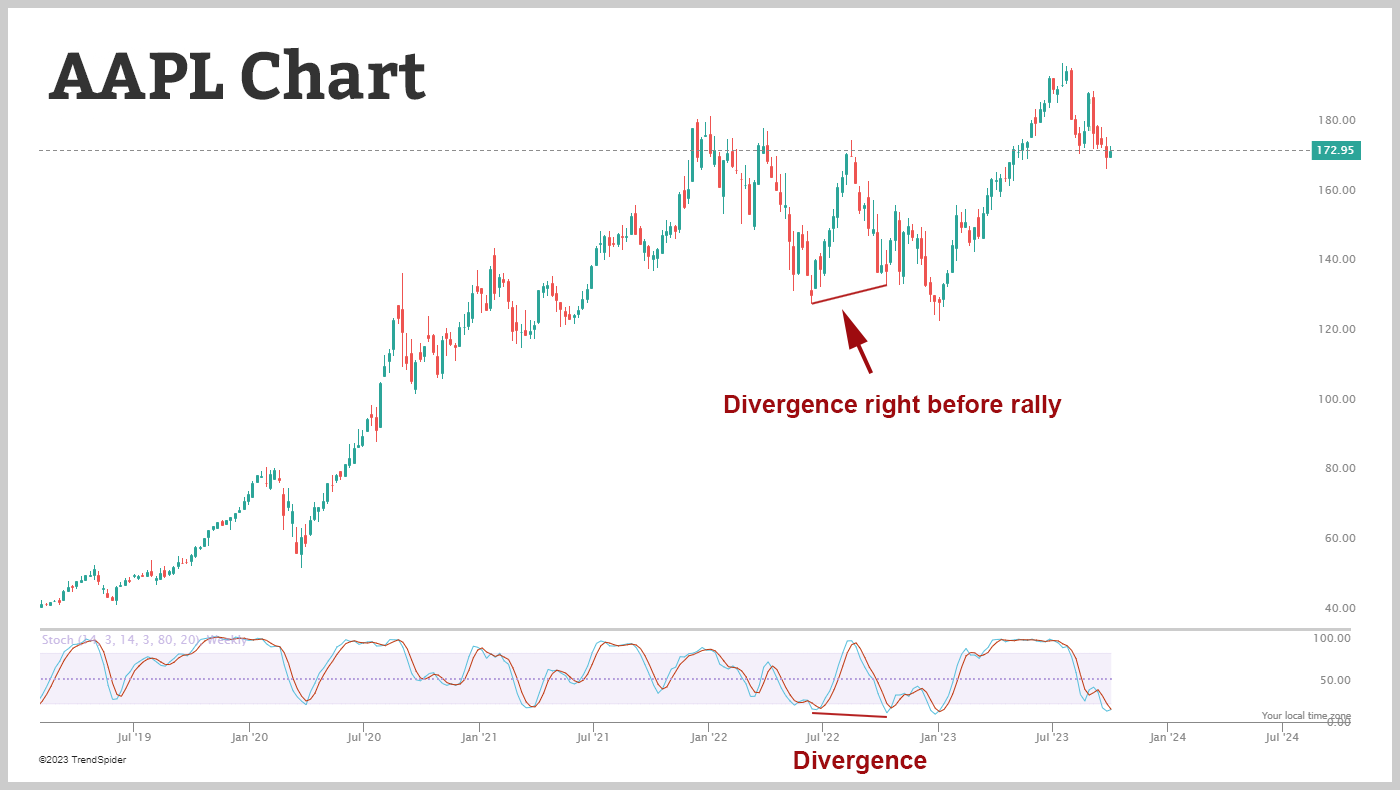
A bearish divergence, on the other hand, appears when prices make higher highs while the stochastic indicator makes lower highs. It suggests that purchasing pressure is waning, which can portend a bullish turn in the price trend.
Divergence signals can help traders anticipate shifts in market momentum before they occur. Combining these signals with other technical indicators or chart patterns can enhance their reliability for making trading decisions.
Using Overbought/Oversold Levels as Exit Points
The Stochastic Indicator can be used to determine exit points in addition to serving as an entry signal. A smart moment to take profits or think about closing long holdings is when an asset hits an overbought condition (over 80), which signals that there may be little upside potential left.
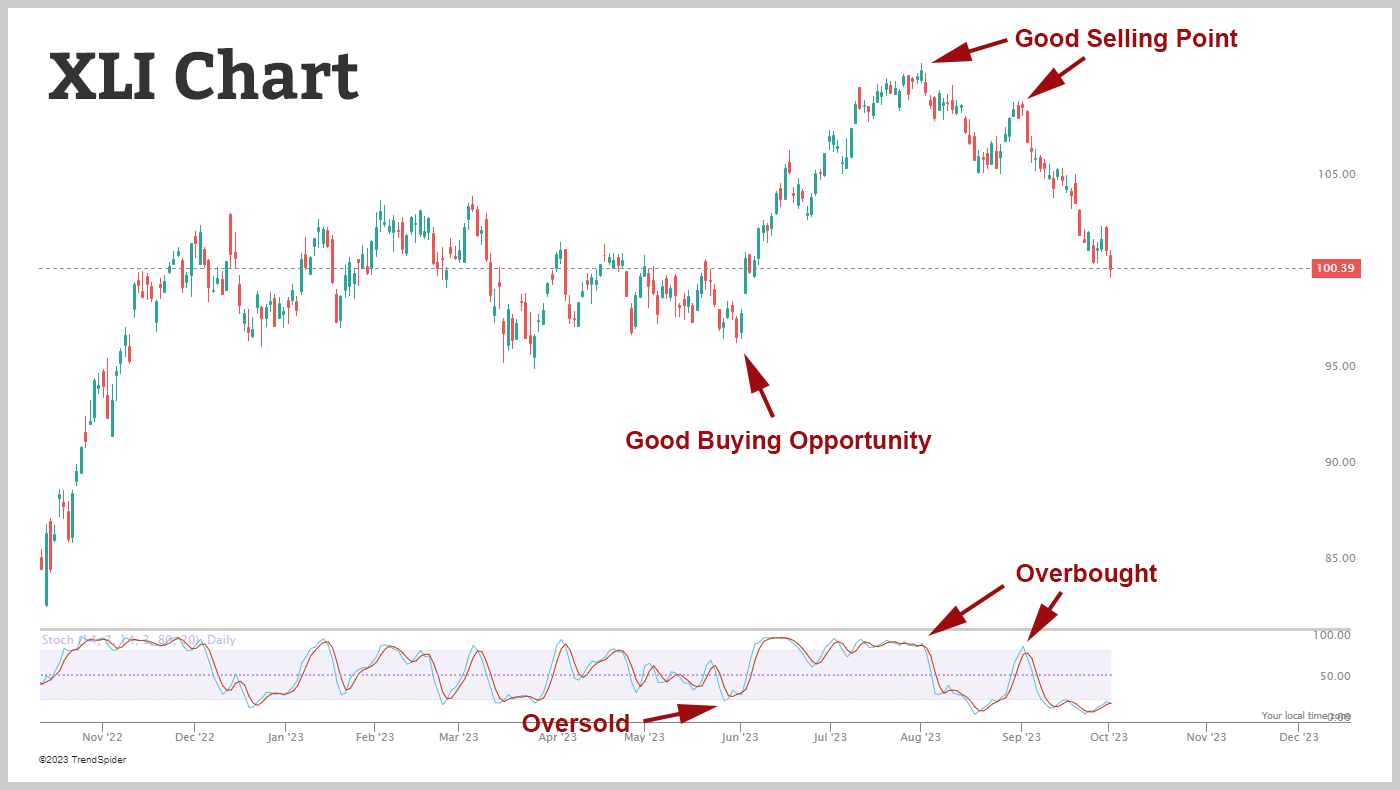
On the other hand, when an asset is oversold (below 20), it means that the selling pressure may have peaked and offers a good chance to close out short holdings or start new long ones.
Using Various Time Frames
Traders frequently utilize various time frames for analysis to optimize the power of the Stochastic Indicator. One can acquire a more thorough grasp of market patterns and probable reversals by comparing %K and %D readings over several time periods, such as daily, weekly, and monthly charts.
For instance, if the weekly chart is still trending upward but the daily chart indicates overbought conditions, this can point to a brief reversal inside a longer-term positive trend. This additional viewpoint aids traders in decision-making and helps them avoid potentially erroneous signals.
Using the Stochastic Indicator in Combination with Other Tools
The Stochastic Indicator can be a strong tool on its own, but using it in conjunction with other technical analysis tools increases its dependability. Before placing trades, traders frequently employ moving averages, support and resistance levels, or chart patterns to validate Stochastic signals.
For instance, the possible reversal signal is strengthened if the stochastic indicator indicates that an asset is oversold while also finding support at a significant Fibonacci retracement level.
Another great combination is the Stochastic Indicator with the ADX (Average Directional Index) indicator. The ADX gauges the strength of a prevailing trend. By using them together, traders gain a comprehensive view of the market. When the Stochastic signals a potential reversal, the ADX can confirm whether the trend is indeed strong or weakening.
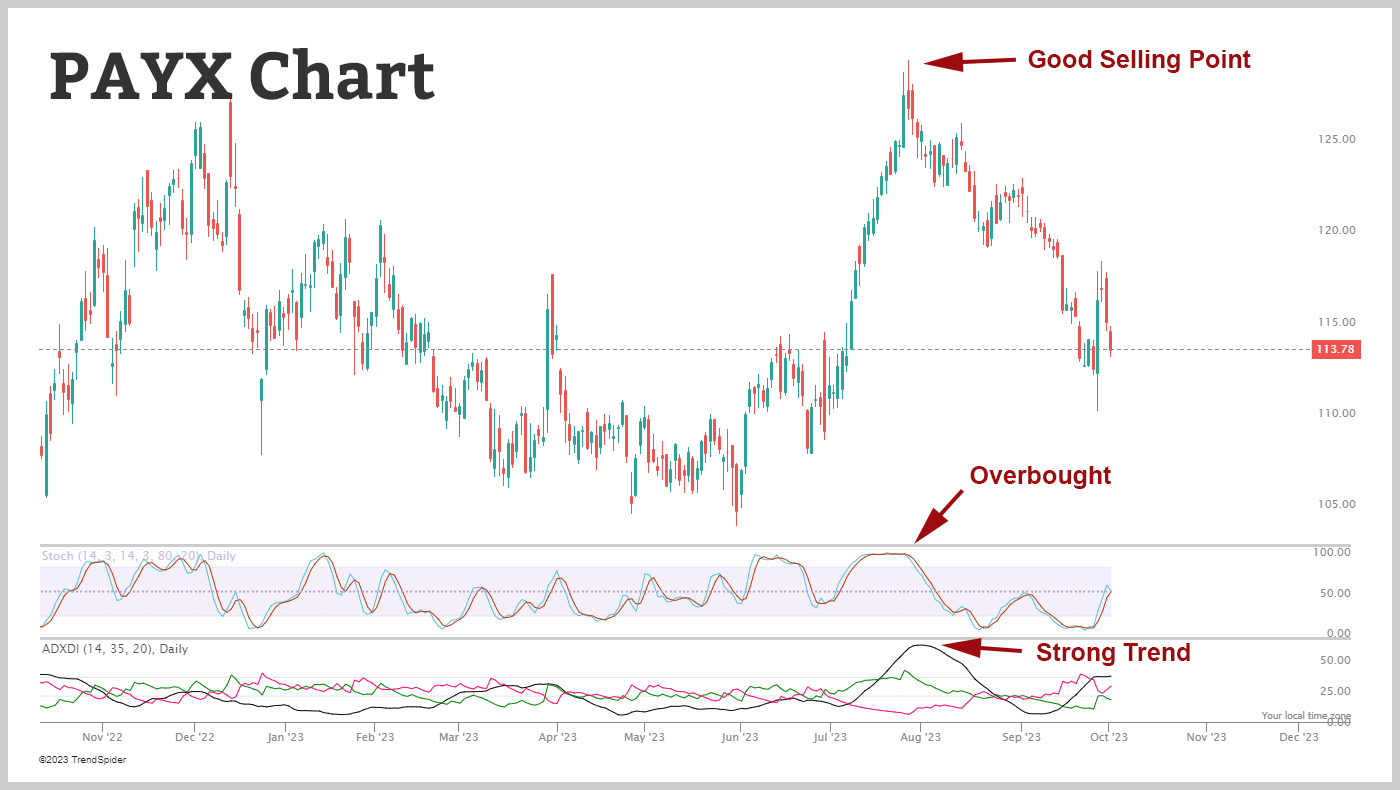
This confirmation helps traders make better decisions, reducing false signals and increasing the likelihood of propery timed trade. When used properly, the Stochastic Indicator provides entry and exit points, while the ADX offers crucial details on the underlying trend’s strength. Using combinations will help traders achieve a higher understanding of market dynamics.
Wrap Up
The stochastic indicator is a valuable tool to assist traders when taking on the financial markets. Its ability to identify overbought and oversold conditions, spot divergences, determine entry and exit points, and provide insights across multiple time frames makes it highly useful for traders and investors alike.
However, like any technical indicator, it is not bulletproof and should be used in conjunction with other tools to increase the probablity of a successful trade. With proper understanding and application, the stochastic indicator can significantly enhance anyones trading strategy and improve their chances of success when executing a trade.
Before you leave, make sure to pick up our free options trading course, where you can learn the power of trading with high probablity indicators. This course empowers you to unlock the full potential of price fluctuations and learn how to implement the right trading strategies to capitalize on various market scenarios. This free course offers insights through detailed explanations and visual aids, equiping you with the skills to recognize stock chart patterns and trading scenarios. Get our free course to accelerate your investing proficiency and elevate your trading skills to the next level.