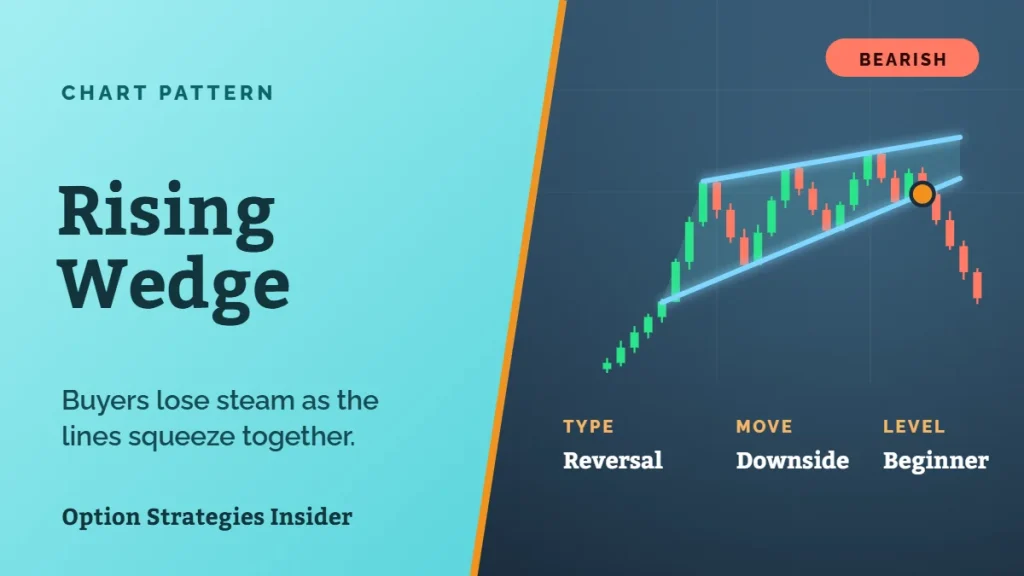
The rising wedge pattern is a bearish chart pattern that forms when a stock keeps making higher highs and higher lows, but each push higher covers less ground than the one before. The two trendlines slope up and squeeze together, and that squeeze is the tell. On the surface, buyers still look like they’re in control. Underneath, they’re running out of gas. When price finally slips below the lower trendline, the move down can come quickly.
You’ll usually find a rising wedge in one of two places. At the end of a long uptrend, it often marks the top before a reversal lower. In the middle of a downtrend, it can show up as a weak bounce that rolls over and continues the decline. Either way, the message is the same: the move inside the wedge is losing steam.
A rising wedge needs at least two higher highs and two higher lows. Draw one line across the highs and another across the lows. Both lines point up, but the lower line climbs faster than the upper line, so the gap between them keeps shrinking as the pattern develops.
Understanding the Rising Wedge
That narrowing shape tells you a lot about what’s happening under the hood. Each rally runs into sellers sooner than the last one, so the highs only inch higher. Meanwhile, dip buyers keep stepping in at higher and higher prices to get in. That works until it doesn’t. Eventually the dip buyers stop showing up, price closes below the lower trendline, and the stock gives back much of what it gained inside the wedge.
Volume matters here. In a good rising wedge, volume tends to fade as the pattern forms and then picks up on the breakdown. A breakdown on light volume is easier to fake, so I like to see real selling pressure behind the move before I trust it.
Because the trendlines converge, the distance between your entry and your stop is usually tight. That’s what makes the rising wedge attractive. You can be wrong for a small loss, and if the breakdown follows through, the reward is often several times the risk.
Attributes
- Pattern type: Reversal or continuation pattern
- Indication: Bearish
- Breakdown confirmation: A close below the lower trendline drawn across the rising lows, ideally on above-average volume.
- Measuring: Take the height of the widest part of the wedge and subtract it from the breakdown point.
- Volume: Tends to decline as the wedge forms and expand on the breakdown.
Rising Wedge Trading Example
Say a stock grinds higher for a few months. The widest part of the wedge runs from $44 up to $52, and each rally after that stalls a little sooner while the lows keep climbing. Price then closes below the lower trendline at $51. Here’s a simple plan:
- Entry: a close below the lower trendline, at $51 in this case.
- Stop: just above the most recent high inside the wedge, around $54.
- Target: subtract the $8 height of the widest part from the breakdown, which points to about $43.
That’s about $3 of risk for $8 of potential reward, which is the kind of setup worth waiting for.
Rising Wedge vs. Falling Wedge
They’re mirror images. A rising wedge slopes up and usually breaks down. A falling wedge slopes down and usually breaks up. Both tell you the same thing, though: the trend inside the wedge is running out of momentum, and the breakout tends to go the other way.
Rising Wedge vs. Ascending Triangle
Both patterns have rising lows, so they’re easy to mix up. An ascending triangle has a flat top, which shows buyers testing the same ceiling over and over, and it usually breaks out higher. A rising wedge has a rising top that climbs more slowly than the lows, and it usually breaks down. If the upper line is flat, think triangle. If it’s tilting up and the lines are pinching together, think wedge.
Trading the Rising Wedge With Options
Once the wedge breaks down, a bear put spread (a put debit spread) gives you defined risk on the move lower and costs less than buying a long put outright. If you’d rather collect a credit, a bear call spread (a call credit spread) above the broken trendline pays you as long as the stock stays under it.
Already own the stock? A protective put is a simple way to cover yourself if the wedge resolves lower, without having to sell your shares.
Common Rising Wedge Mistakes
- Calling it too early. A rising wedge isn’t a sell signal until price actually closes below the lower trendline. Plenty of wedges keep grinding higher longer than you’d expect.
- Forcing the lines. If the highs and lows aren’t getting closer together, it’s a price channel, not a wedge, and channels trade differently.
- Ignoring volume. A breakdown on thin volume is more likely to snap back into the pattern.
Rising Wedge FAQ
Is a rising wedge bullish or bearish? Usually bearish. It most often breaks down, but no pattern works every time, so wait for the close below the lower trendline.
How long does a rising wedge take to form? Often several weeks to a few months on a daily chart.
What’s the difference between a rising wedge and a rising channel? In a channel, the two lines run parallel. In a wedge, they converge, which shows momentum fading.
Where can I see more patterns? Our guide to stock chart patterns covers them all.
Conclusion
The rising wedge is one of the more useful warning signs on a chart because it shows up while the stock still looks strong. Higher highs and higher lows look healthy at a glance, but when the gains keep shrinking and the lines start to pinch together, the rally is running on fumes. Wait for the close below the lower trendline, check that volume confirms it, and then use the height of the wedge to set a realistic target. To learn more about stock chart patterns, check out our full library of chart patterns, with clear examples so you can spot these setups and become a better trader.
Spotting a rising wedge is half the trade. The other half is knowing which options strategy to use when it breaks down, and our free course on trading options walks you through that step by step.