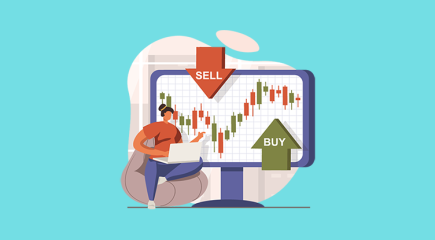
Stock trading is fun, captivating, and worth the money when you do it right. Therefore, you need to understand the intricacies of the technicality in trading. It translates to knowing how to retrieve the strength and potential of shares in the stock market before you purchase or sell. Ideally, you need to understand the opening, highest, lowest, and even the closing price of a share before you make your move.
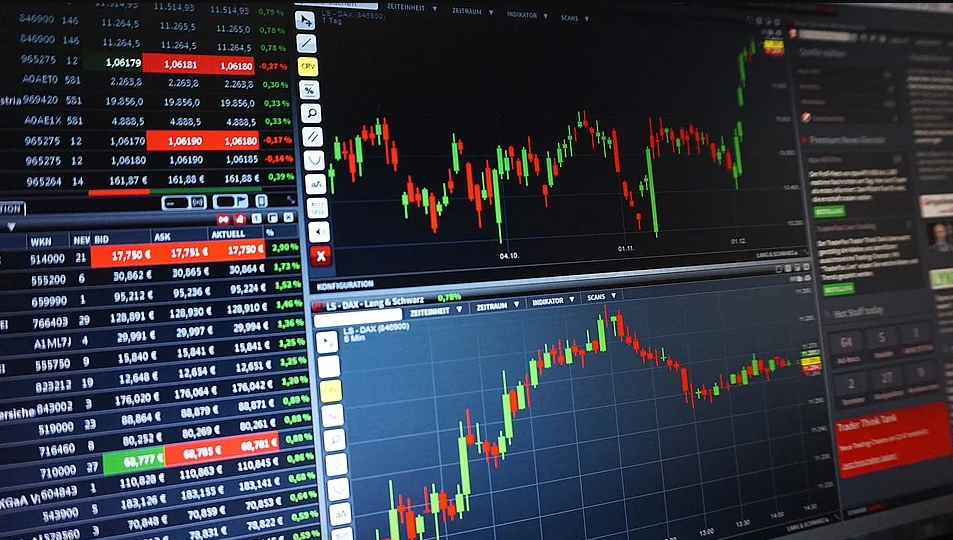
A compilation of various candlestick patterns farms their candlestick chart. The church is what informs your decision before making a trade. The candlestick pattern specifically highlights the opening price, together with the highest, lowest, and even closing of stock for that specific period.
You need to properly read a stock chart patterns mainly because you can carefully interpret the bullish and bearish prices. The ease of interpreting the above features is a major boost from the traditional chart method in interpreting stock. Taking a glance at the candlesticks’ colors gives you timely information about whether the market is predominantly bullish or bearish. Additionally, you can also quickly identify the candlesticks’ dimension, which will show the stock price in the market.
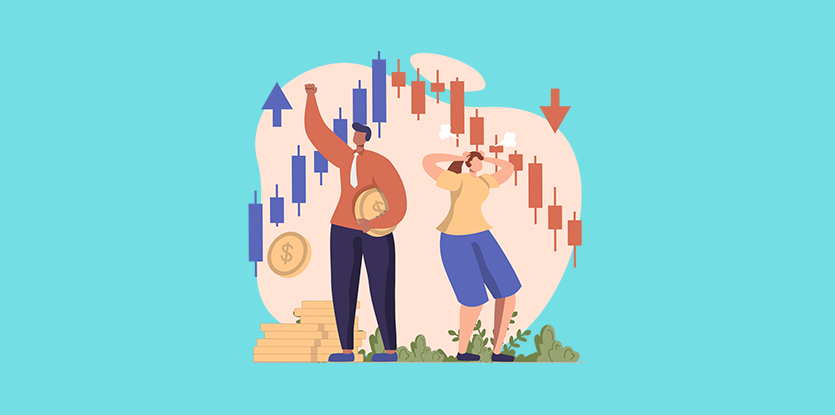
Bullish
With the Japanese candlestick pattern, you can identify the bullish prices, which translates to the market’s high and strong prices.
The opening is usually at the bottom, which gradually moves upwards to close at the upper part. When it signals its reversal, identify how to trade the bullish engulfing pattern with smart moves. At that time, buyers take charge of the market.
As a trader, if you notice the candle has a white or green color, it indicates a bullish price with an upward trend.
Bearish
The bearish points in the stock chart patterns indicate the low prices in the market. Therefore, the signals will indicate a downward trend, which may occur in different lengths. Therefore, as the length of the body of the candlestick pattern increases, it shows a significant price drop. The black or red color shows bearish prices.
The Anatomy
The anatomy of the candlestick pattern shows a direct relationship with the typical candle you use. A candle has its body, made up of wax, and the wick, which translates to the shadow. Therefore, when the week is longer than average, it shows a significant pull and push between buyers and sellers, which will influence the trend’s position. It may either halt or ultimately reverse to a new one. When it shows a short wick, it indicates that the current trend may continue.
Its body reflects the distance between opening and closing. The candlesticks have two distinct colors, which will influence your trading.
Comprehension
When you understand the working of a Japanese candlestick pattern, you will easily grasp the information about the stock you’re interested in trading. Additionally, the interpretation is fast, and you can quickly make a decision. It will allow you more time to trade when you have the information you need after going through it.
To become a successful stock trader, you need to identify the current prices of shares in the market properly. With this chat, you can easily identify whether the market is becoming stronger or weaker before making a move.
Identify Trends
It is one of the most effective strategies you need to implement. When trading, you should understand the market trend carefully. Understanding the trend will help you identify the point you should enter or exit from the trade. Trends are essential in highlighting the history, current, and even the potential of the stock price in the future.
Furthermore, the Japanese candlestick pattern allows you to see all bearish and bullish prices, which are not accessible in other charts. Plus, if you consider the reversal strategy a fundamental principle in how you trade your shares, this chart is ideal for you.
The Supply and Demand
One of the most incredible aspects of running a successful business is to properly evaluate your product’s supply and demand relationship with market prices influencing the decision. It is no exception even in forex trading. Thankfully, the candlestick patterns will help you easily interpret the above features, helping you make well-informed decisions when trading.
Get All Information
Think of the convenience in getting accurate and timely information at your fingerprints on the information you need when making a trade will stop with the candlestick pattern, you can also identify the trading interaction between buyers, sellers, and even brokers for a certain duration which will influence your decision in the trade.
Furthermore, the Japanese candlestick chart allows you to comprehend the direction of the stock market instantly. When you have the right grasp in understanding the Japanese candlestick pattern, your trading positions get better, and you can rake in more profits.