
Predicting markets in 2024 can be tricky, yet we can gain insights into what’s probable when it comes to markets if we look at the trends. One key indicator offers a high success rate at giving us a glimpse into the potential trajectory of various assets.
You might be familiar with the indicator I’m referring to, as it is popular among many investors.
Initially, when an asset establishes a trend, whether an ascent or descent, it tends to sustain that movement. Subsequently, a shift in trend signals a potential shift in an asset’s direction, indicating impending challenges or the onset of a bullish phase.
Numerous methods exist to assess trends, but for today, let’s focus on two widely used techniques involving moving averages. By employing averages, the aim is to filter out the day-to-day price fluctuations, revealing the direction in which the asset is heading.
50-Day Moving Average & 200-Day Moving Average
Our attention today centers on the 50-day moving average (50-DMA) and the 200-day moving average (200-DMA).
If your trade timeline spans a month or two, the 50-DMA should command your focus. Conversely, for longer-term trades spanning several months or years, the 200-DMA becomes pivotal.
When scrutinizing moving averages, two primary considerations come into play. Firstly, during bullish periods, assets typically reside above their moving averages, while bearish markets witness assets below these averages for extended periods.
Secondly, the trajectory of the moving averages themselves acts as a signifier of trends. When they exhibit upward or downward movement, assets frequently continue in the corresponding direction.
These commonly tracked moving averages also serve as crucial levels of “support” and “resistance.” Support denotes a level where asset buying occurs, often halting price declines, while resistance reflects a level where selling intensifies, impeding further price increases. Should an asset breach either support or resistance, it frequently sustains that directional movement.
Shifting our focus to the broader market, let’s consider the S&P 500 Index. Throughout 2022, it remained predominantly below its declining 200-DMA, with its short-term trend exhibiting a downward trajectory. However, a notable shift occurred in 2023 when the market breached its 200-DMA in late January while soon after the 50-DMA crossed above the 200-DMA, which is known as the golden cross.
Take a look:
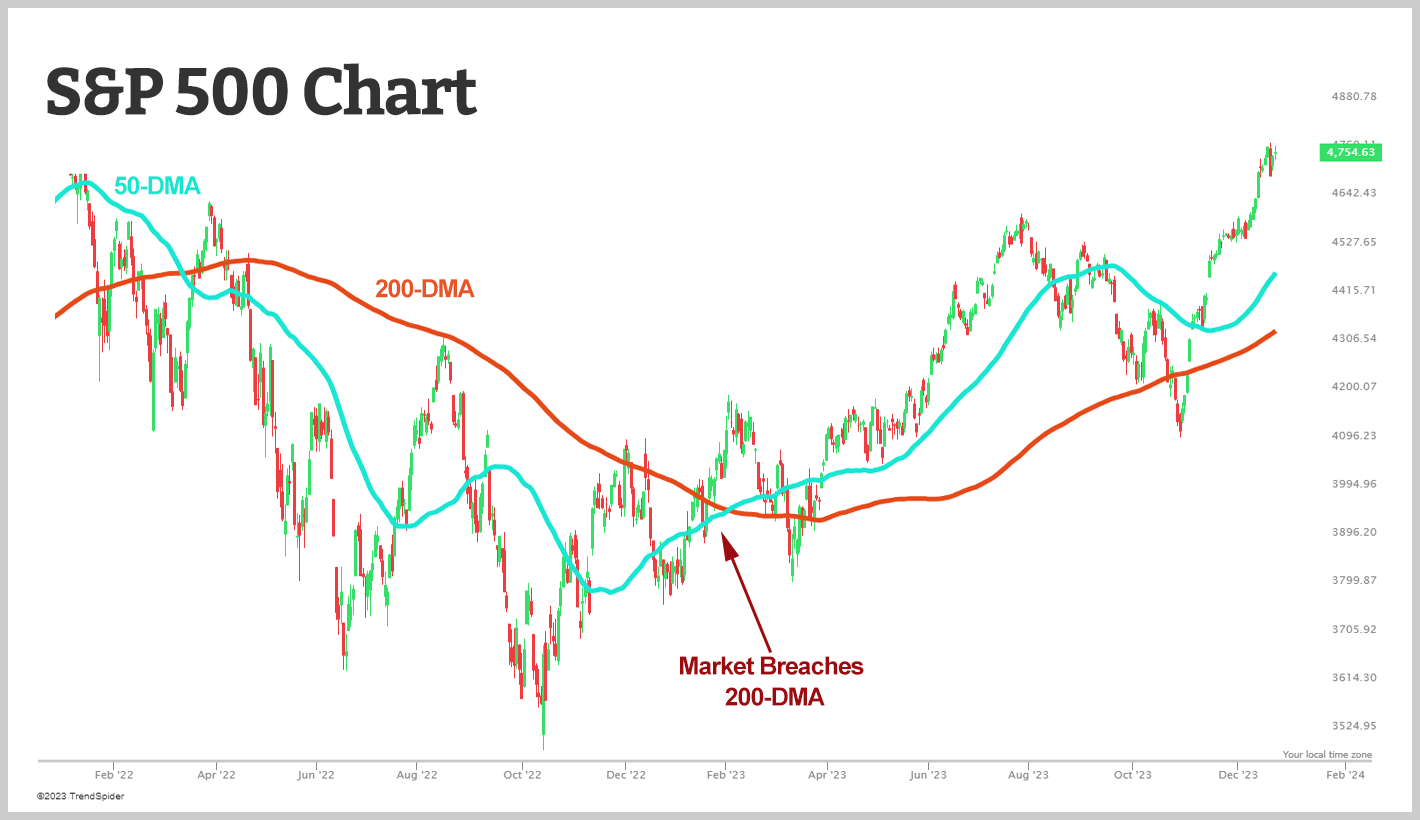
Since then, the market has largely traded above this ascending trendline. Despite sporadic dips below the trend line, particularly in October, the overall upward long-term trend validated a stance against panic, proving prudent.
The current scenario indicates double-digit growth in the S&P 500 so far. With both short-term and long-term trends on the rise, it’s plausible to anticipate this trend continuing into 2024. While acknowledging the likelihood of challenges ahead, the current rally suggests room for further growth.
For those who have yet to invest in the S&P 500, the SPDR S&P 500 ETF Trust (SPY) is a great option.
Banking Sector
Shifting gears to the banks, their story contrasts sharply with the broader market. This sector has experienced a downtrend since early 2022, aggravated by the regional bank crisis in March.
However, signs of a turnaround are surfacing, notably observed through the Financial Select Sector SPDR Fund (XLF). After predominantly trailing below its declining 200-DMA for the past couple of years, XLF is now displaying a substantial breakthrough of the 200-DMA. Shortly their after, the 50-DMA crossed above the 200-DMA creating the golden cross.
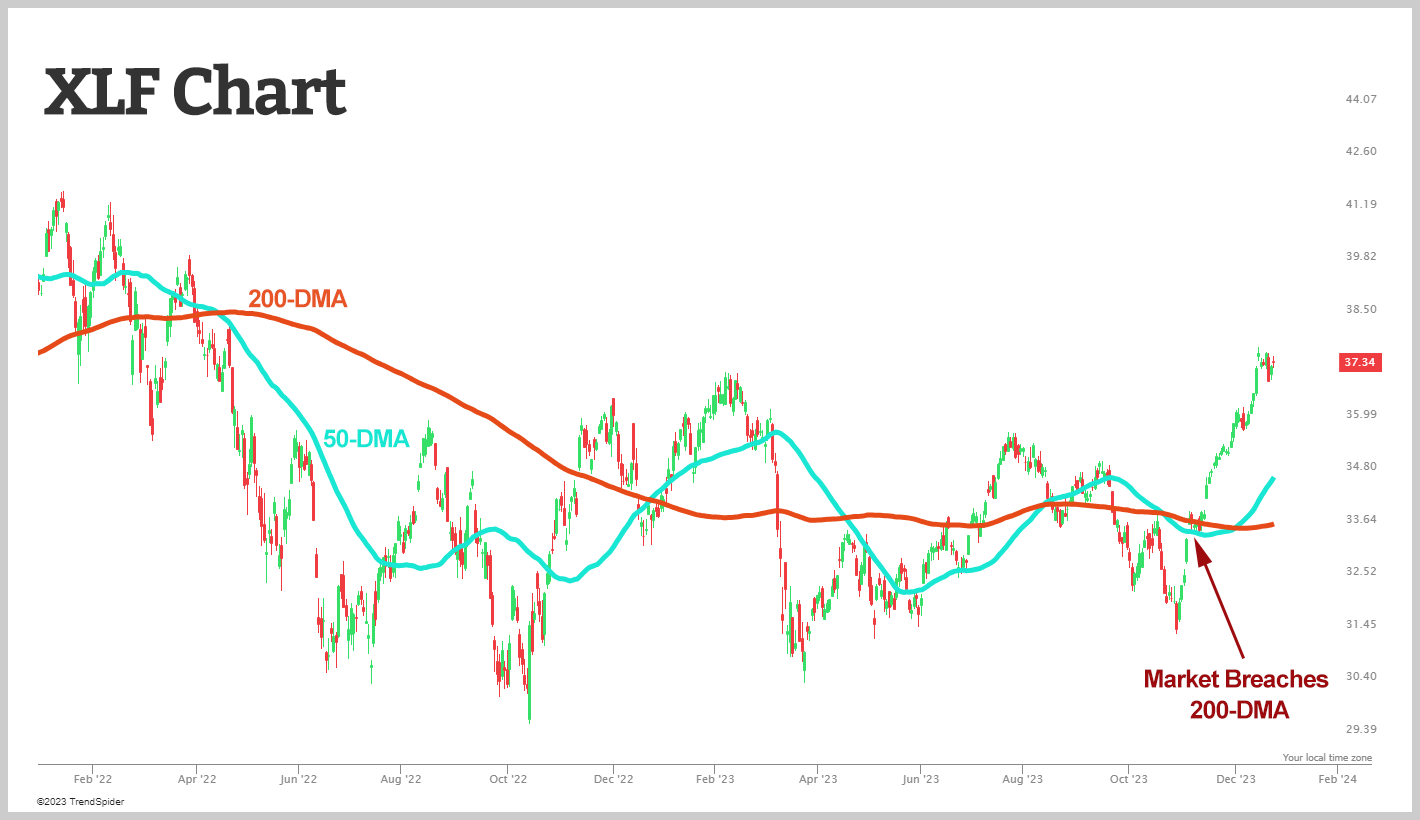
XLF’s short-term trend is already on an upward trajectory, while the 200-DMA is showing signs of stabilization after a consistent decline since early 2022. Our previous assessments of XLF have been on point, indicating that this could be the nascent stage of an upward trend for XLF.
The breached 200-DMA is likely to serve as a support level in 2024, potentially minimizing the impact of any setbacks.
Expectations lean towards an upward trajectory for this market segment in the upcoming year. Adding XLF to your investment portfolio might be a strategic move given the evolving trends.
Wrap Up
In conclusion, as we approach the end of 2023, significant shifts in trends are apparent. The overall market is approaching previous peak levels, while bank stocks demonstrate signs of an upward swing, hinting at positive prospects moving into the new year.
At Option Strategies Insider, we’re committed to providing valuable insights and guidance for navigating the dynamic world of trading. Understanding market trends and indicators is crucial for making informed investment decisions. To equip yourself with the necessary tools and knowledge, we invite you to sign up for our free options trading course. Gain access to expert strategies and essential tips that can empower you on your trading journey. Don’t miss out on this opportunity to elevate your trading skills and make well-informed choices in the market. Join us today for free and embark on a path towards trading success! Sign up now to access your free options trading course and take the first step towards achieving your financial goals.