This research report was produced by The REIT Forum with assistance from Big Dog Investments.
Following reader feedback, we’ve enhanced the layout for this series. Your continued feedback is greatly appreciated, so please leave a comment with suggestions.
This article will be heavy on charts because we like to communicate with images, rather than words, whenever possible. Likewise, we will use several tables to more efficiently structure the data. Enjoy!
Mortgage REITs and Preferred Shares
We’ve consistently incorporated a significant allocation to preferred shares in our portfolio. We could simply hold the positions for income, but we take advantage of trading opportunities as well. Our goal is to maximize total returns and this technique has worked wonderfully.
We also trade positions in the mortgage REIT common shares. We find this sector is particularly attractive because it can be so inefficient. In the long term, share prices revolve around book value. In the short term, the price-to-book ratios can deviate materially. Simply by understanding that, you can put yourself in a better position.
Our other major source of allocations is equity REITs. While an investor might occasionally choose to trade an equity REIT position, the sector is a great fit for buy-and-hold investors.
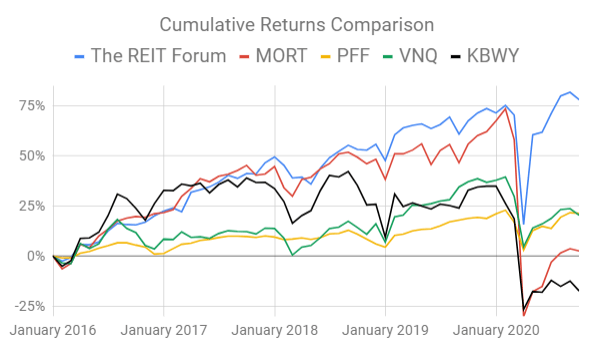
We compare our performance against 4 ETFs that investors might use for exposure to our sectors:
Source: The REIT Forum
The 4 ETFs we use for comparison are:
|
Ticker |
Exposure |
|
MORT |
One of the largest mortgage REIT ETFs |
|
PFF |
One of the largest preferred share ETFs |
|
VNQ |
Largest equity REIT ETF |
|
KBYW |
The high-yield equity REIT ETF. Yes, it has been dreadful. |
When investors think it isn’t possible to earn solid returns in preferred shares or mortgage REITs, we politely disagree. The sector has plenty of opportunities, but investors still need to be wary of the risks. We can’t simply reach for yield and hope for the best. When it comes to common shares, we need to be even more vigilant to protect our principal by regularly watching prices and updating estimates for book value and price targets.
Mortgage REITs
Price-to-Book Value – Using Q2 2020 Book Value
Let the images begin!
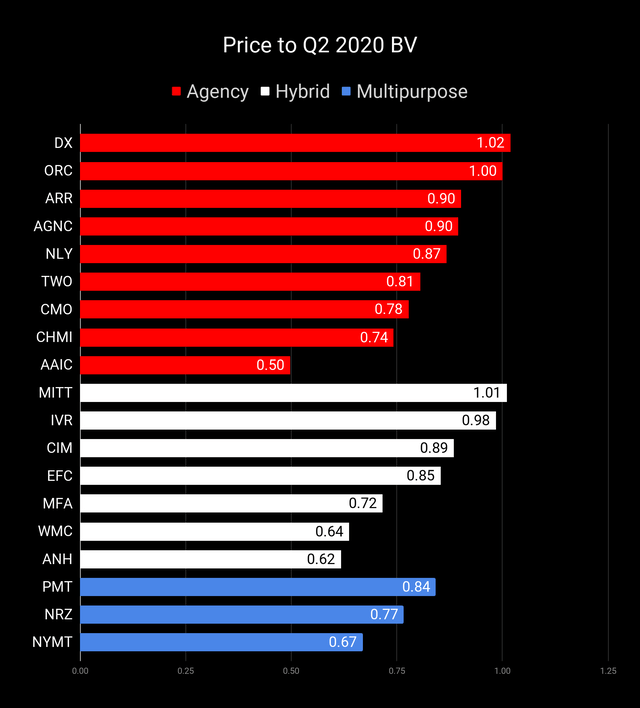
Source: The REIT Forum
Remember that these are price-to-trailing-book ratios. They are not using estimates of current book value. Book values have changed during Q3 2020 and to a lesser degree during Q4 2020.
Repeated Note: There are three mortgage REITs we need to highlight here:
- Two Harbors – We are using Q2 2020 book value adjusted to add back the $.54 per share as a result of terminating the management agreement for cause. If this decision was made prior to the end of Q2 2020, it would’ve raised BV accordingly. This is equivalent to GAAP book value excluding the $.54 charge recorded during Q2 2020.
- AG Mortgage Investment Trust – We are using the Q2 2020 book value reported by management, which does not deduct the value of accrued dividends for preferred shares. If the preferred dividends were paid, it would reduce common book value under these calculations. This method is accepted under GAAP.
- MFA Financial reports “GAAP book value” and “economic book value.” We’ve chosen to use the GAAP book value to remain consistent.
Unfortunately, we have to repeat those bullet points every time we publish because it regularly comes up if we don’t mention it.
Price-to-Book Value – Using Q3 2020 Book Value
Some mortgage REITs have already reported Q3 book values, if so, you can find them in the price-to-book chart below. If a company has reported their book value within 24 hours prior to public release of this article, please cut us a little slack.
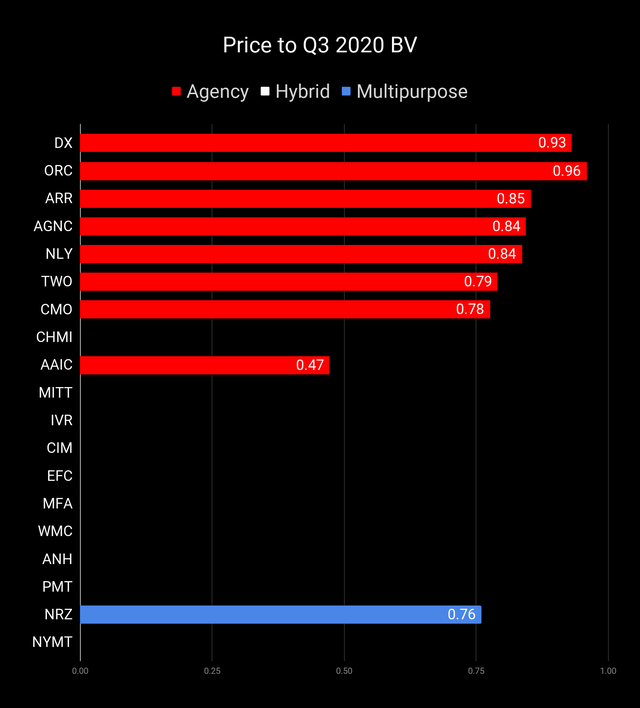
Source: The REIT Forum
Book values will have changed some already during Q4 2020. We aren’t including that in our public articles (except for index cards). Scott Kennedy provides frequent updates on estimated book value, ratings, and price targets through The REIT Forum.
Dividend Yields
Dividend yields often come up in the comments, but picking based on dividend yield is stupid and regularly results in terrible performance. Don’t do it.
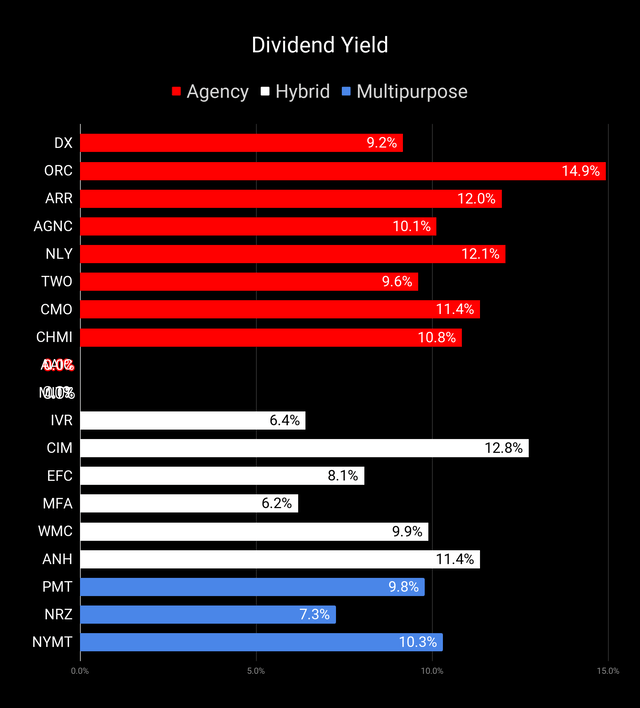
Source: The REIT Forum
This chart is still in the same order as the prior charts. Consequently, you know the highest price-to-book ratios (using trailing GAAP book value) for each segment will be at the top. If you see a mistake, please feel free to say something. Occasionally the data for dividend rates requires a manual update.
Earning Yields
One of the next things investors may ask about is the yield using core earnings. This chart puts together the core earnings based on the consensus analyst estimate. Beware that the consensus estimate may not always be the best estimate.
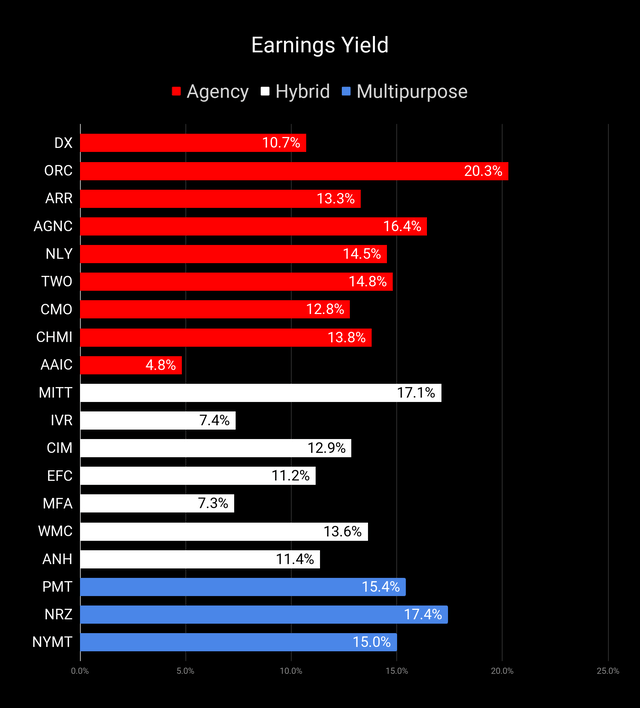
Source: The REIT Forum
Consensus estimates aren’t always the best and there are ways to increase “Core Earnings” through accounting decisions or modifying hedges. Consequently, investors should still take these values cautiously. We do not depend on the consensus estimate to make decisions.
Preferred Shares
After testing out a series on preferred shares, we decided to try merging it into the series on common shares. After all, we are still talking about positions in mortgage REITs. We don’t have any desire to cover preferred shares without cumulative dividends, so any preferred shares you see in our column will have cumulative dividends. You can verify that by using Quantum Online. We’ve included the links in the table below:
|
Ticker |
Recent Price |
Bond or FTF |
Stripped Yield |
Current Yield |
Coupon |
Floating Yield On Price |
Annualized YTC |
Quantum Online Link |
|
AGNCM |
$22.15 |
FTF |
7.81% |
7.76% |
6.88% |
5.20% |
11.6% |
AGNCM |
|
AGNCN |
$22.90 |
FTF |
7.69% |
7.64% |
7.00% |
5.85% |
12.5% |
AGNCN |
|
AGNCO |
$22.11 |
FTF |
7.39% |
7.35% |
6.50% |
5.92% |
10.7% |
AGNCO |
|
AGNCP |
$21.60 |
FTF |
7.13% |
7.09% |
6.13% |
5.72% |
10.7% |
AGNCP |
|
NLY-D |
$25.22 |
7.53% |
7.43% |
7.50% |
7.53% |
3.2% |
NLY-D |
|
|
NLY-F |
$22.44 |
FTF |
7.84% |
7.74% |
6.95% |
5.88% |
14.0% |
NLY-F |
|
NLY-G |
$20.89 |
FTF |
7.88% |
7.78% |
6.50% |
5.32% |
16.2% |
NLY-G |
|
NLY-I |
$22.45 |
FTF |
7.61% |
7.52% |
6.75% |
5.87% |
10.8% |
NLY-I |
|
MFO |
$23.70 |
Bond |
8.47% |
8.44% |
8.00% |
8.47% |
1072.9% |
MFO |
|
ARR-C |
$23.55 |
7.46% |
7.43% |
7.00% |
7.46% |
8.9% |
ARR-C |
|
|
DX-B |
$24.85 |
7.72% |
7.67% |
7.63% |
7.72% |
21.5% |
DX-B |
|
|
DX-C |
$21.98 |
FTF |
7.90% |
7.85% |
6.90% |
6.50% |
11.0% |
DX-C |
|
CMO-E |
$23.00 |
8.21% |
8.15% |
7.50% |
8.21% |
151.1% |
CMO-E |
|
|
EFC-A |
$20.06 |
FTF |
8.44% |
8.41% |
6.75% |
6.76% |
14.6% |
EFC-A |
|
NRZ-A |
$20.32 |
FTF |
9.26% |
9.23% |
7.50% |
7.43% |
15.2% |
NRZ-A |
|
NRZ-B |
$19.25 |
FTF |
9.29% |
9.25% |
7.13% |
7.63% |
17.0% |
NRZ-B |
|
NRZ-C |
$17.69 |
FTF |
9.05% |
9.01% |
6.38% |
7.35% |
18.5% |
NRZ-C |
|
AIC |
$23.25 |
Bond |
7.35% |
7.26% |
6.75% |
7.35% |
140.6% |
AIC |
|
AIW |
$23.97 |
Bond |
6.93% |
6.91% |
6.63% |
6.93% |
73.8% |
AIW |
|
ANH-A |
$23.20 |
9.37% |
9.29% |
8.63% |
9.37% |
137.2% |
ANH-A |
|
|
ANH-C |
$21.58 |
8.90% |
8.83% |
7.63% |
8.90% |
264.9% |
ANH-C |
|
|
CIM-A |
$22.46 |
9.00% |
8.90% |
8.00% |
9.00% |
20.5% |
CIM-A |
|
|
CIM-B |
$20.53 |
FTF |
9.86% |
9.74% |
8.00% |
7.40% |
16.2% |
CIM-B |
|
CIM-C |
$19.13 |
FTF |
10.25% |
10.13% |
7.75% |
6.56% |
16.4% |
CIM-C |
|
CIM-D |
$19.49 |
FTF |
10.39% |
10.26% |
8.00% |
7.26% |
18.6% |
CIM-D |
|
PMT-A |
$23.22 |
FTF |
8.88% |
8.75% |
8.13% |
6.60% |
11.3% |
PMT-A |
|
PMT-B |
$23.11 |
FTF |
8.78% |
8.65% |
8.00% |
6.81% |
11.2% |
PMT-B |
|
TWO-A |
$21.66 |
FTF |
9.43% |
9.38% |
8.13% |
6.82% |
11.8% |
TWO-A |
|
TWO-B |
$20.44 |
FTF |
9.38% |
9.33% |
7.63% |
6 |
12.7% |
TWO-B |
|
TWO-C |
$19.09 |
FTF |
9.55% |
9.49% |
7.25% |
6.88% |
16.8% |
TWO-C |
|
TWO-D |
$22.21 |
8.79% |
8.72% |
7.75% |
8.79% |
212.2% |
TWO-D |
|
|
TWO-E |
$21.81 |
8.66% |
8.60% |
7.50% |
8.66% |
244.8% |
TWO-E |
|
|
CHMI-A |
$22.83 |
9.05% |
8.98% |
8.20% |
9.05% |
14.3% |
CHMI-A |
|
|
CHMI-B |
$19.96 |
FTF |
10.42% |
10.33% |
8.25% |
7.38% |
17.6% |
CHMI-B |
|
IVR-A |
$21.51 |
9.07% |
9.01% |
7.75% |
9.07% |
269.5% |
IVR-A |
|
|
IVR-B |
$20.83 |
FTF |
9.44% |
9.30% |
7.75% |
6.57% |
14.3% |
IVR-B |
|
IVR-C |
$20.81 |
FTF |
9.14% |
9.01% |
7.50% |
6.70% |
12.0% |
IVR-C |
|
NYMTM |
$18.66 |
FTF |
10.64% |
10.55% |
7.88% |
8.98% |
18.7% |
NYMTM |
|
NYMTN |
$19.03 |
FTF |
10.60% |
10.51% |
8.00% |
7.83% |
15.1% |
NYMTN |
|
NYMTO |
$19.71 |
10.07% |
9.99% |
7.88% |
10.07% |
441.5% |
NYMTO |
|
|
NYMTP |
$19.65 |
9.94% |
9.86% |
7.75% |
9.94% |
447.4% |
NYMTP |
|
|
AI-B |
$18.00 |
9.84% |
9.72% |
7.00% |
9.84% |
35.4% |
AI-B |
|
|
AI-C |
$18.92 |
FTF |
11.05% |
10.90% |
8.25% |
7.87% |
20.4% |
AI-C |
|
MFA-B |
$19.94 |
9.54% |
9.40% |
7.50% |
9.54% |
423.5% |
MFA-B |
|
|
MFA-C |
$17.01 |
FTF |
9.70% |
9.55% |
6.50% |
8.29% |
20.3% |
MFA-C |
|
MITT-A |
$16.75 |
13.43% |
12.31% |
8.25% |
13.43% |
912.4% |
MITT-A |
|
|
MITT-B |
$17.00 |
12.78% |
11.76% |
8.00% |
12.78% |
871.8% |
MITT-B |
|
|
MITT-C |
$16.96 |
FTF |
12.81% |
11.79% |
8.00% |
10.71% |
25.8% |
MITT-C |
There are a few things you should know at the start:
- When a share can be called on short notice, the annualized yield-to-call reaches absurd levels. Investors shouldn’t put too much weight on it. On the other hand, a negative number can be a significant concern. Consequently, we decided to include it in the chart.
- The last preferred shares in this group with a suspended preferred share dividend are from AG Mortgage Investment Trust (MITT).
- We sort our spreadsheet for subscribers by risk ratings within each sector. We decided to use the same technique for this series since it communicates more information to readers. You’ll notice a general correlation where lower risk correlates with a higher price and lower yield, though this link isn’t absolute.
For each metric we have 2 charts. Why use two charts? Because it is much more convenient for readers who want to enlarge the charts. We simply can’t fit 40+ shares into a single chart and still have it show up well on a mobile device.
Share Prices
We will start with the prices:
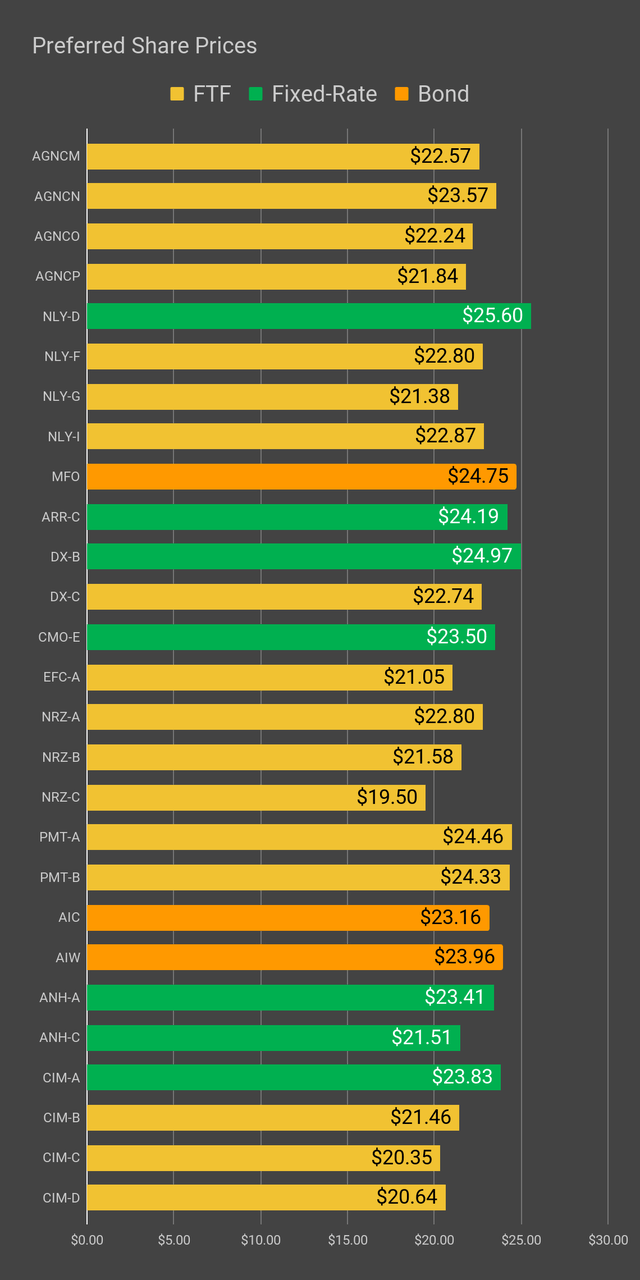
Source: The REIT Forum
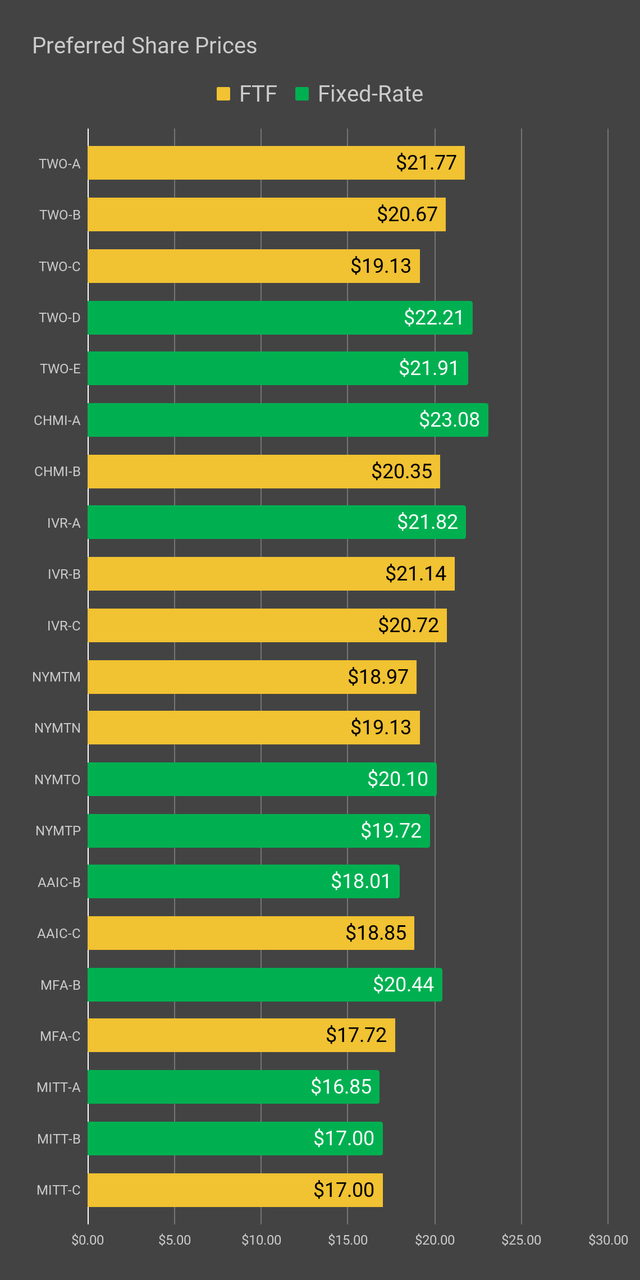
Source: The REIT Forum
That chart gives you a pretty quick feel for which shares are trading at a discount to call value. Each of these preferred shares has a call value of $25.00, but that doesn’t mean a share will be called. The company decides if they want to issue a call or not.
Dividend Yield
Let’s move onto the stripped yield. This is the way dividend yields should be handled for preferred shares:
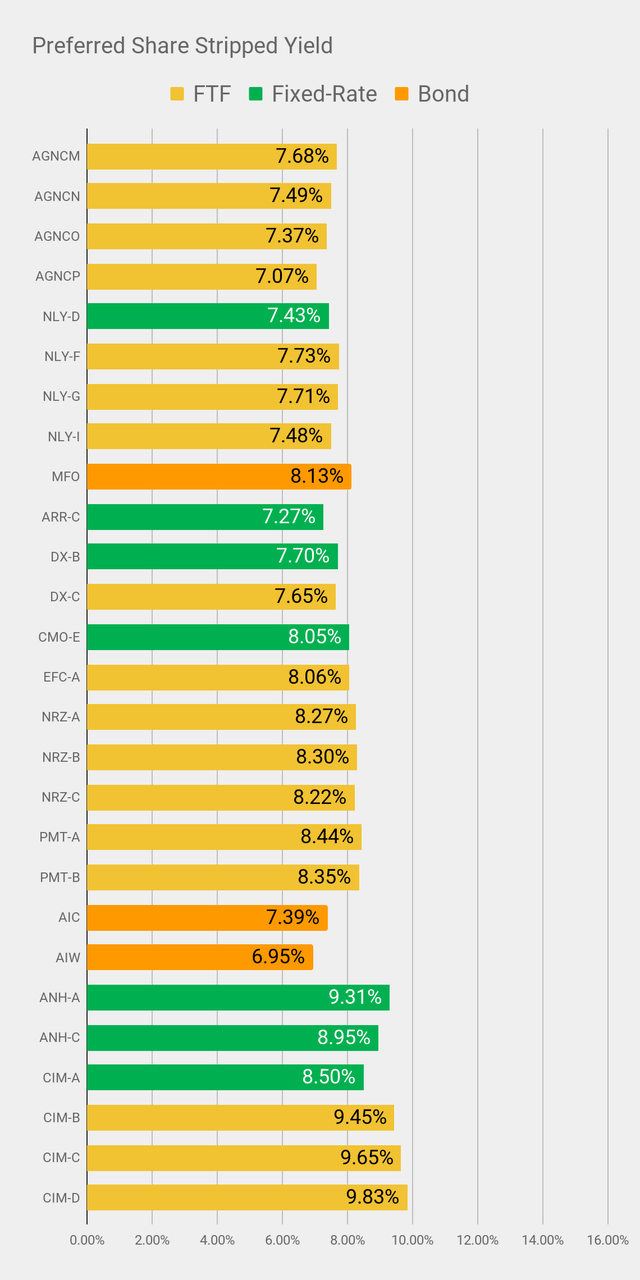
Source: The REIT Forum
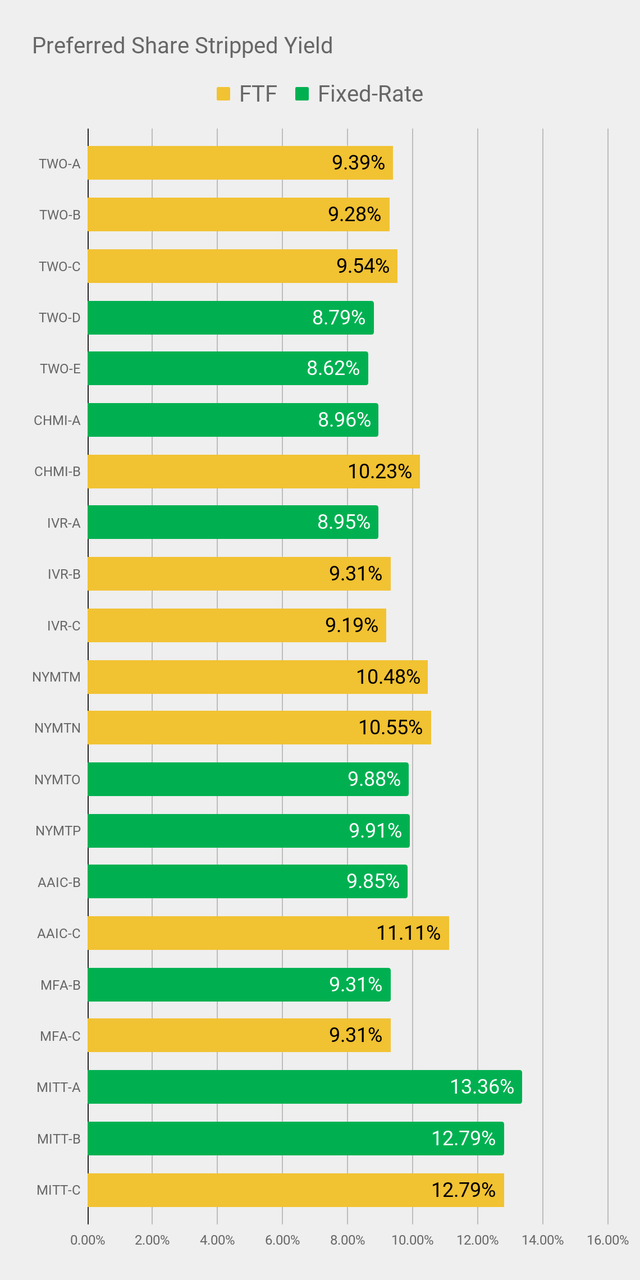
Source: The REIT Forum
Stripped yields are vastly more useful than “current” yields for preferred shares. The stripped yield uses the stripped price. That’s different from using the current price because it means we already adjusted for dividend accrual. This makes the process easier for investors.
We can talk about shares using “regular prices.” Those are the prices an investor would actually use when entering an order.
However, we will provide the stripped yield to adjust for the dividend accrual. In the spreadsheets we host for subscribers, we include the actual ex-dividend date, or the projected ex-dividend date if the actual date isn’t yet known. If you’re planning to buy a share, it’s always wise to check if the shares just went ex-dividend so you can adjust your targets accordingly.
Floating Rate Dividend Yields
Since many of these shares switch over to floating rates, we also want to consider what the yield would be if the floating rate was in effect and shares were still at the current price. To demonstrate that, we use the “Floating Yield On Price.” If the share remains at a fixed-rate indefinitely, then the value doesn’t change:
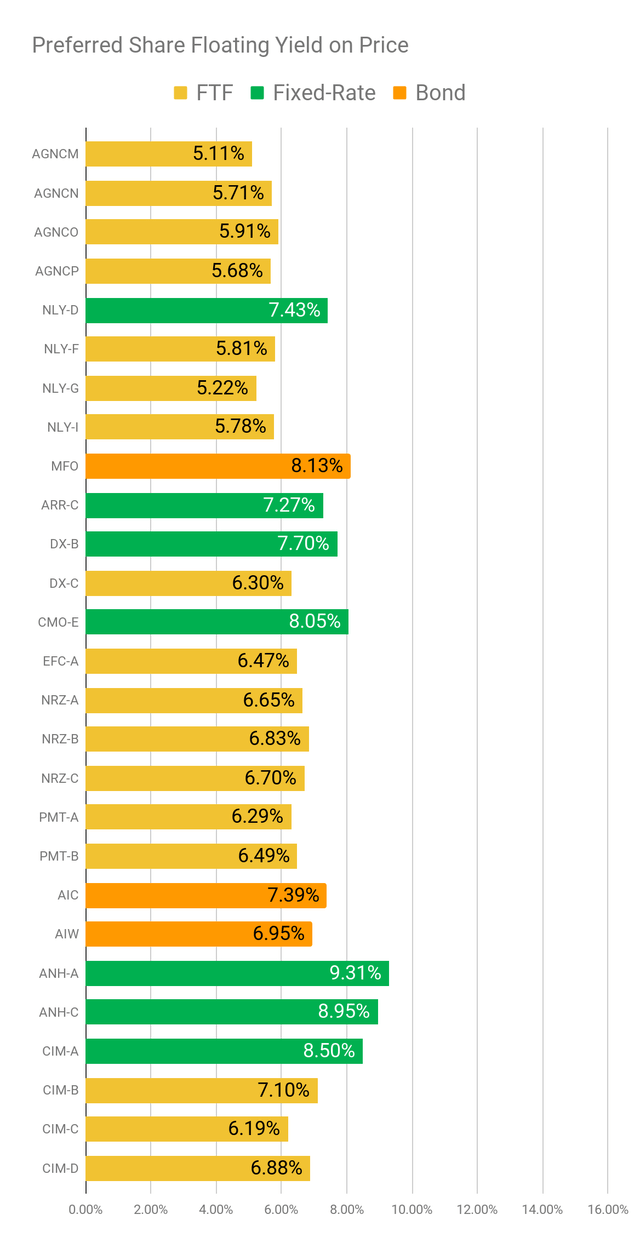
Source: The REIT Forum
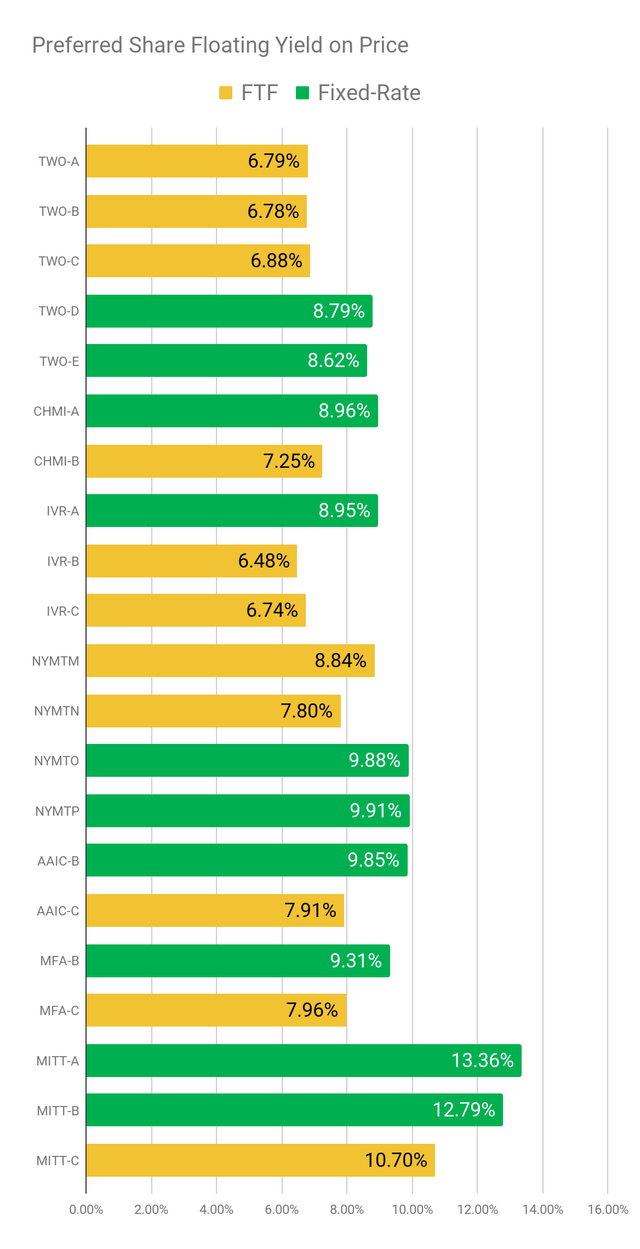
Source: The REIT Forum
One point we need to emphasize here is that we are dealing with yields. A yield must involve the share price. We aren’t simply showing the new “rate” if the share began floating, we are adjusting the new rate for the stripped price.
Focusing On Individual Shares
With the broad view of the sector covered, we’re going to focus on a few individual shares.
ARMOUR Residential REIT
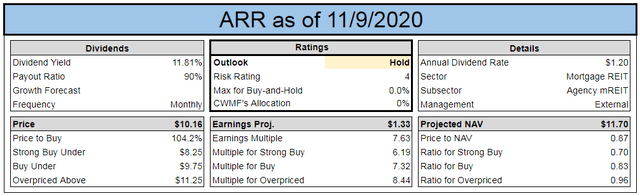
Source: The REIT Forum
ARR trades at an estimated price-to-book (or price-to-NAV) ratio of .87. That’s not too high, but it isn’t very cheap either. When we contrast that with several peers, we find ARR actually carries a higher price-to-book ratio than some of the larger (and internally managed) mortgage REITs. For instance, the price-to-book ratio here is slightly higher than it is for AGNC or NLY.
Some investors are going to suggest that you can’t just look at ARR’s price-to-book ratio and start building towards an intelligent decision. I disagree.
While book value is not the end of the analysis, it is the cornerstone upon which your case should be built.
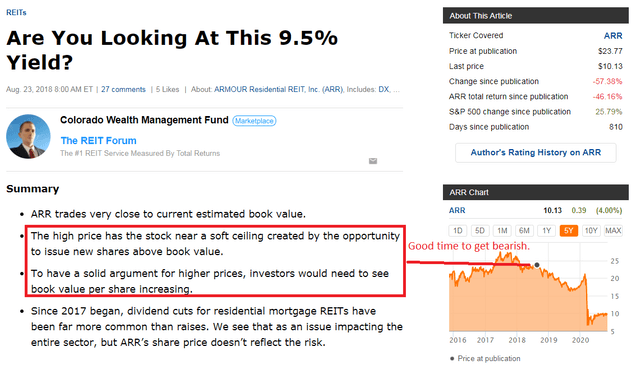
Bearish in August 2018:
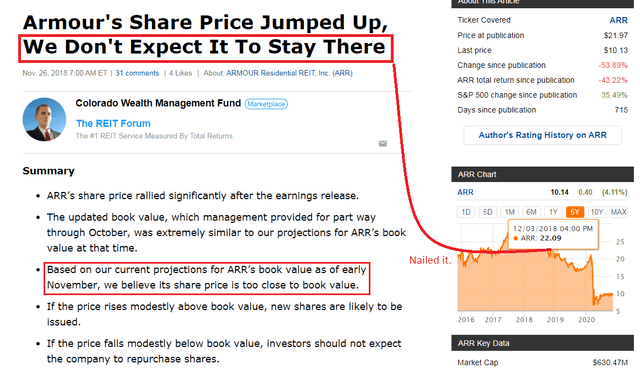
Bearish in November 2018:
Bullish in October 2019
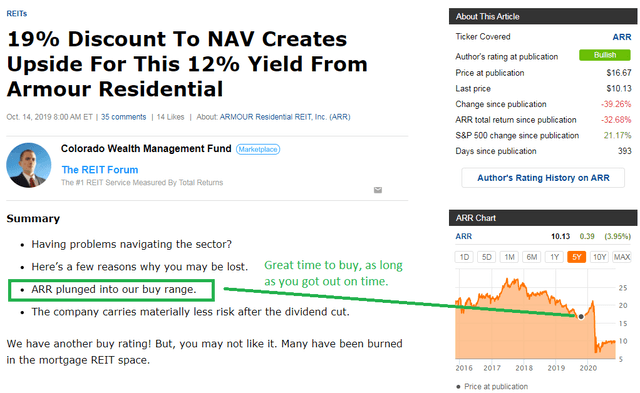
Investors simply needed to get out on time. Did we make that call?
Sounding the Alarm in February 2020
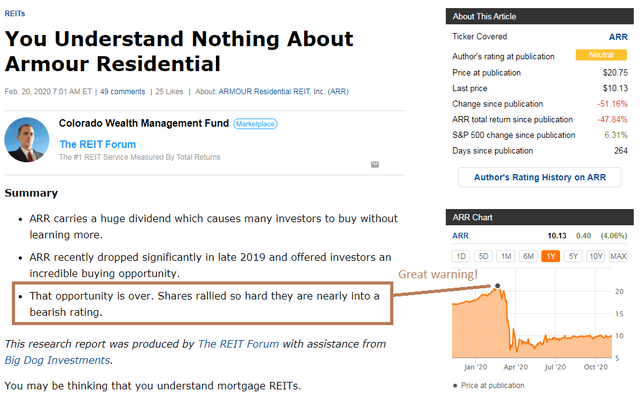
That’s a pretty great series of calls. Perhaps even more impressive is that I put together these calls only using our public releases on ARR. As we told investors in ARR on February 20, 2020:

Source: IMGflip
Now I understand some investors are sure to say:
Yeah, okay, whatever. If you weren’t such a jerk, you would’ve told public investors they should buy shares after the plunge.
Bullish in May 2020
We got bullish on ARR:
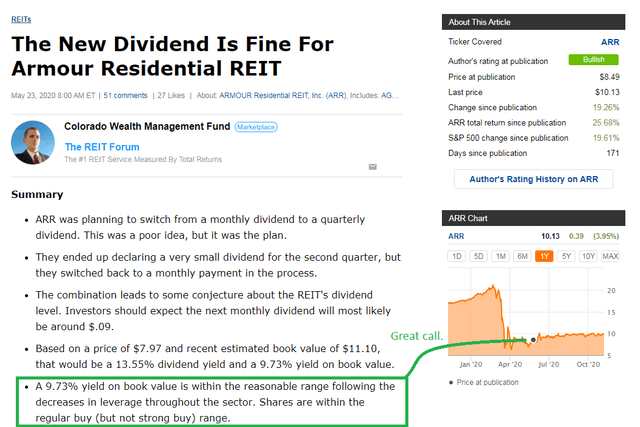
Yet again, you see an emphasis on book value. We’ve highlighted that the dividend looks quite sustainable simply because it only represents a 9.73% yield on book value. The thesis of the article was that ARR could very reasonably cover a dividend of $.09 per share on a monthly basis. This disputed the idea that ARR would only be able to pay that on a quarterly basis.
What happened?

Source: Schwab
Dividends were increased from $.09 to $.10 and paid out a monthly basis. It was pretty simple when you know to start the analysis with book value.
Neutral Today
Today we are sitting at a neutral rating. ARR delivered great returns, at least since our prior bullish rating, but there are better options in the sector today. That’s easy to understand if you’re able to remember that analysis on mortgage REITs starts with book value. It doesn’t end with book value. The book value should never be seen as the ending point of analysis. Instead, it is the prerequisite to doing intelligent analysis.
So when we go neutral on ARR, we don’t need to do anything complicated. There isn’t a complicated story here. The price has a moderate discount to book value. The discount is too small to be bullish, but too big to be bearish. Congratulations, you get a neutral outlook.
Vaccine
I know someone wants to scream:
There is a vaccine you moron!
Great. Glad there is a vaccine on the way. No, that doesn’t change the analysis. We’ll have other articles talking about investments where the vaccine has a more significant impact.
Other Neutral Outlooks
We’re also taking a neutral stance on a few other shares.
Common shares: EFC, CHMI
Preferred shares: AGNCN, ARR-C, NRZ-A, CIM-B, and TWO-C.
Reasoning: EFC and CHMI have both done quite well lately. Good enough time to call off ratings.
ARR-C is a lower risk choice than ARR common, but has less upside. We were pretty bullish on shares at some points before, but the upside in the price is mostly handled.
NRZ-A is less attractive compared to NRZ-B and NRZ-C. Investors in NRZ-A should really consider swapping for either of the other two.
CIM-B still trades at a $3.35 discount to call value (before including dividend accrual), but it trades at a premium compared to CIM-D. The gap is a bit too wide so CIM-D is a superior choice.
TWO-C looks inferior when compared to TWO-A or TWO-B, so investors using the Two Harbors FTF (fixed-to-floating) shares should emphasize TWO-A or TWO-B rather than TWO-C.
Conclusion
You don’t have to follow us. You don’t have to care about our research. If you’re happy with a high dividend yield and a dwindling account value, there are plenty of authors who can cater to you. On the other hand, if you’re focused on generating total returns and want to use REITs to do it, you may love our research. Hit the “Follow” button beside my name to start seeing more of our research.
Make sure to leave a comment and let us know what you think of the layout.
Ratings:
- Neutral rating on ARR, CHMI, EFC.
- Neutral rating on preferred shares: AGNCN, ARR-C, NRZ-B, CIM-B, TWO-C.
Try our service. See how much better investing can be.

Disclosure: I am/we are long NLY-F,NLY-I,AGNCO,TWO-E,TWO-A,NYMTP,NRZ-C,TWO-B,NRZ-B,NYMTM,CIM-A,NRZ,AGNC,NLY,NYMT,GPMT,SLRC,PMT,AAIC. I wrote this article myself, and it expresses my own opinions. I am not receiving compensation for it (other than from Seeking Alpha). I have no business relationship with any company whose stock is mentioned in this article.
Additional disclosure: As a reminder, Scott Kennedy also is an author for the REIT Forum. You may see his commentary featured in our articles and may notice an extremely high amount of overlap in our ratings, so subscribers reading this article should see Scott’s latest REIT Forum sector update for more detail.