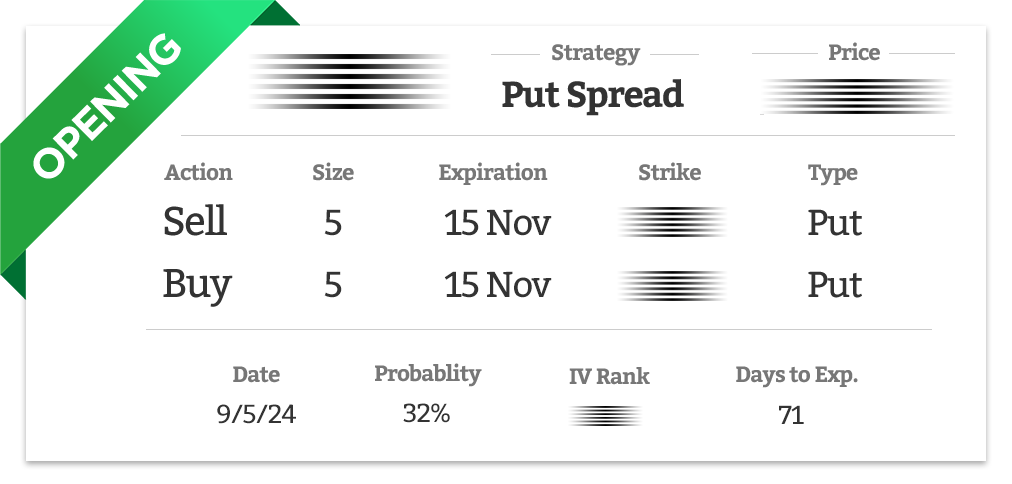
We’re seeing a significant divergence in the market. Stocks are likely to move differently for the remainder of this week and into next week, so I’m planning to start easing into some trades.
What this means is I’ll initiate one trade and allow some flexibility for further gains, then follow up with another trade.
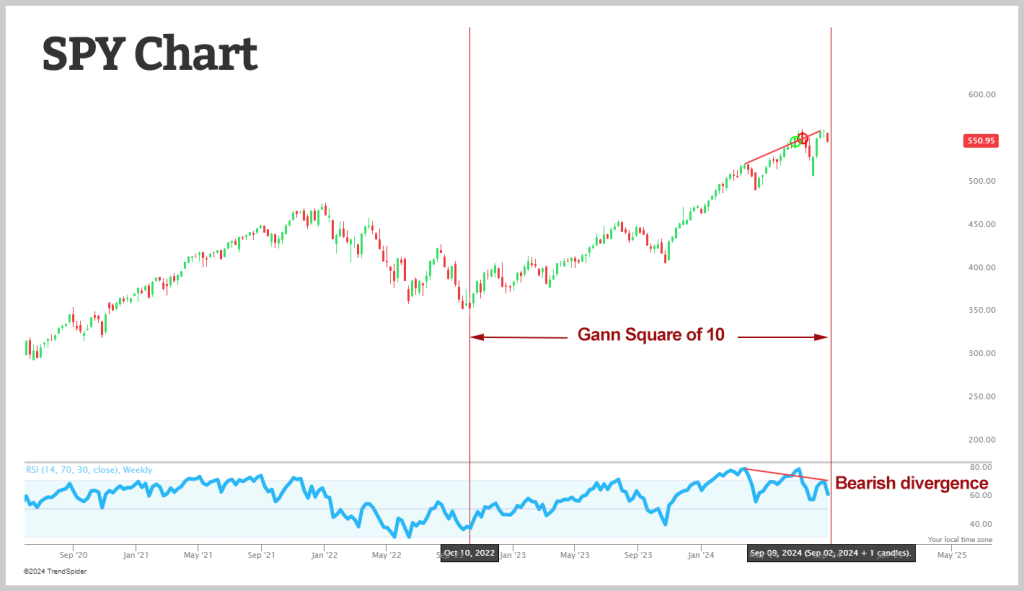
Here’s a weekly chart of the S&P 500 Index…
Next week marks the Gann Square of 10 (100 weeks) from the October 2022 low, a Gann timing factor tied to major swing highs and lows. In this case, we’re moving from a low towards what seems to be a high point.
This is a good indication that the bullish and bearish reversal will start at the end of this week with the start of next week.
Also, take note of the relative strength index (RSI) at the bottom of the chart. It has formed a third lower high (indicated by the red line) while the price continues to climb. This is another bearish short-term signal, which aligns with the cycles and Elliott Wave patterns we’ve been previously posting.
![]() This trade report is for our Executive and Ultra members only! To read the rest of this report you will need to select one of the options below…
This trade report is for our Executive and Ultra members only! To read the rest of this report you will need to select one of the options below…

