Stocks surged yesterday after Producer Price Index (PPI) data came in lower than expected. Today, the Consumer Price Index (CPI) also slightly undershot estimates. So for this morning, markets are not having much of a reaction.
With more economic data coming tomorrow and Friday, further signs of easing inflation could continue to fuel this rally.
This creates an ideal setup—a rally or swing high—heading into the last week of August and early September, a period where my time cycle analysis is signaling a key inflection point.
Let’s focus on the banks. Here’s a look at XLF…
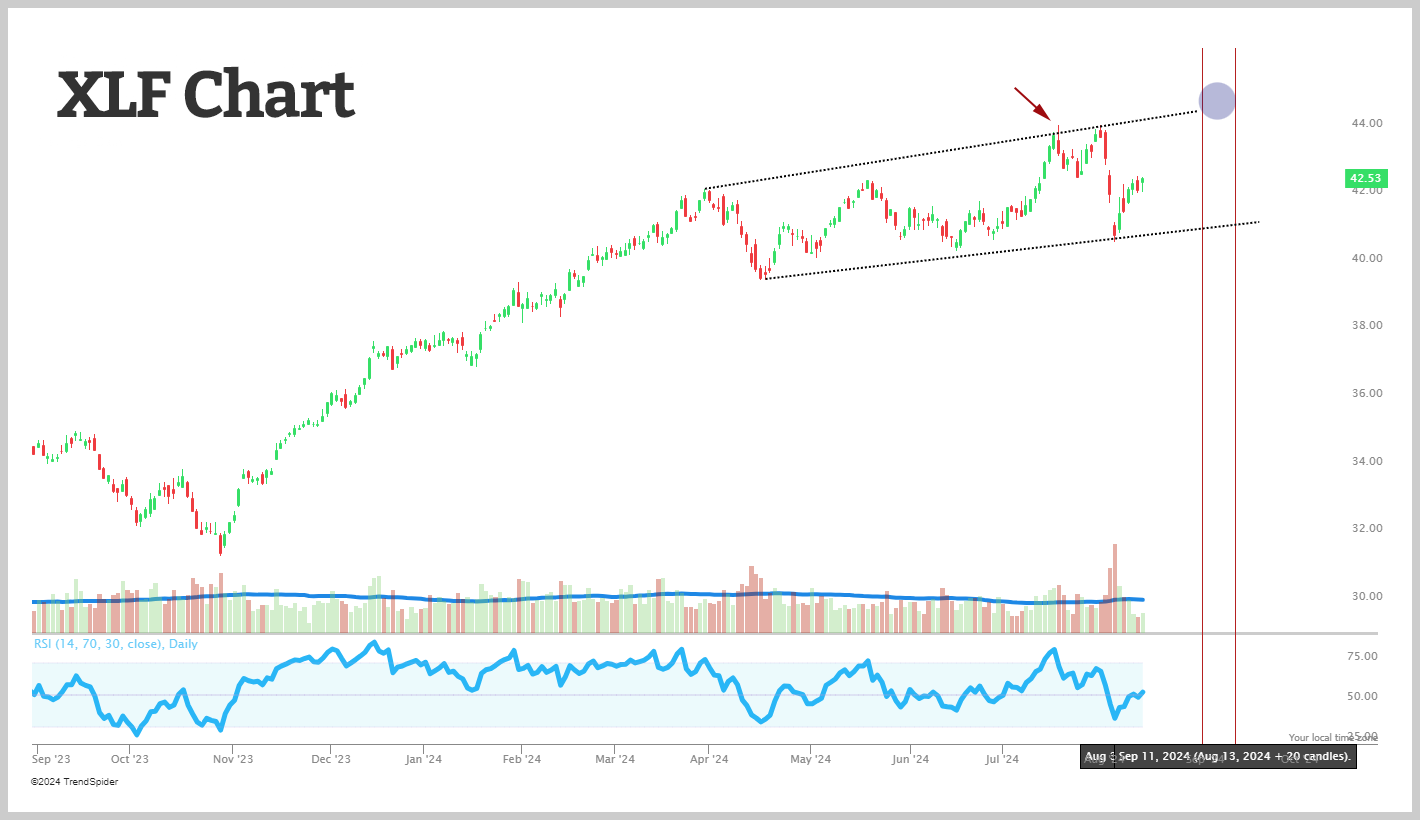
Looking at the chart, it exhibits all the signs of a minor correction.
Within the channel, you can spot a false breakout in July (marked by the red arrow), which triggered a decline. Last week, we saw a false breakdown followed by a snapback.
The key takeaway here is that if this rally continues, XLF could climb back up to the upper resistance level, aligning perfectly with an upcoming time factor window.
Over the next 2-3 weeks, I’ll stress that not all stocks and sectors will react the same way. If we see a high into the time factor, some stocks/sectors might peak early, while others could stretch their rallies into early September. Conversely, if the market reverses and we hit a low during this time window, not all stocks would bottom out simultaneously.
For now, I’m letting our call options run their course. It’s not the right moment to add more risk. I want to see if the rally off last week’s low can continue and confirm a high over the next couple of weeks.