President Herbert Hoover remained firm on “Black Thursday,” even as the Dow Jones Industrial Average took a 21% dive.
Hoover downplayed the signs of economic distress, assuring journalists that:
“The core operations of the nation, involving the production and distribution of goods, are stable and thriving.”
In the midst of October 1929’s escalating turmoil, Hoover concentrated on the overall conditions, maintaining his faith in the market’s resilience. However, this wasn’t just a minor episode of market jitters… The 1929 Crash marked the beginning of the Great Depression, a profound shift that reshaped American life for a decade.
Whether you admire Hoover or not, there’s a valuable takeaway here… Markets are not linear… They can plummet (sometimes for extended periods) and eventually rebound. They can also surge and then adjust themselves due to various factors.
Consider last week’s market behavior… Following unexpectedly mild inflation figures, both bonds and stocks saw an uptick, each climbing around 7% from their lows in April. (The Consumer Price Index remained unchanged in May, after a 0.3% increase in April.) With inflation slowing, there’s a possibility the Federal Reserve might reduce interest rates this year. But as I often point out, the central bank tends to react to past data.
Still, many stocks are reaching new peaks, and bonds have surpassed significant “resistance” points. This is promising. However, we’ve observed some profit-taking, which is to be expected. After all, history teaches us that markets are prone to fluctuations, both at home and internationally.
We might experience increased market volatility in the coming weeks. Should that happen, I’ll explain why it’s crucial not to become overly pessimistic.
Successful trading demands a lot of patience, and that’s particularly true in the current climate. While we are in a bull market at the moment, not all sectors are performing equally. Take, for example, the Dow Jones Transportation Average which has not performed as well as the semiconductor sector, which has surged to new all-time highs.
Some market analysts suggest that this disparity is a solid reason to adopt a bearish stance and consider shorting the market. However, I would advise against such actions without further consideration.
It’s important to remember that these trends are specific to the U.S. stock market. For a more comprehensive understanding, one should also consider the global markets. To illustrate this point, let’s examine the Vanguard Total World Stock Index Fund (VT), which includes a mix of large-cap and small-cap stocks from both the U.S. and other countries around the world.
Here is the VT weekly chart…
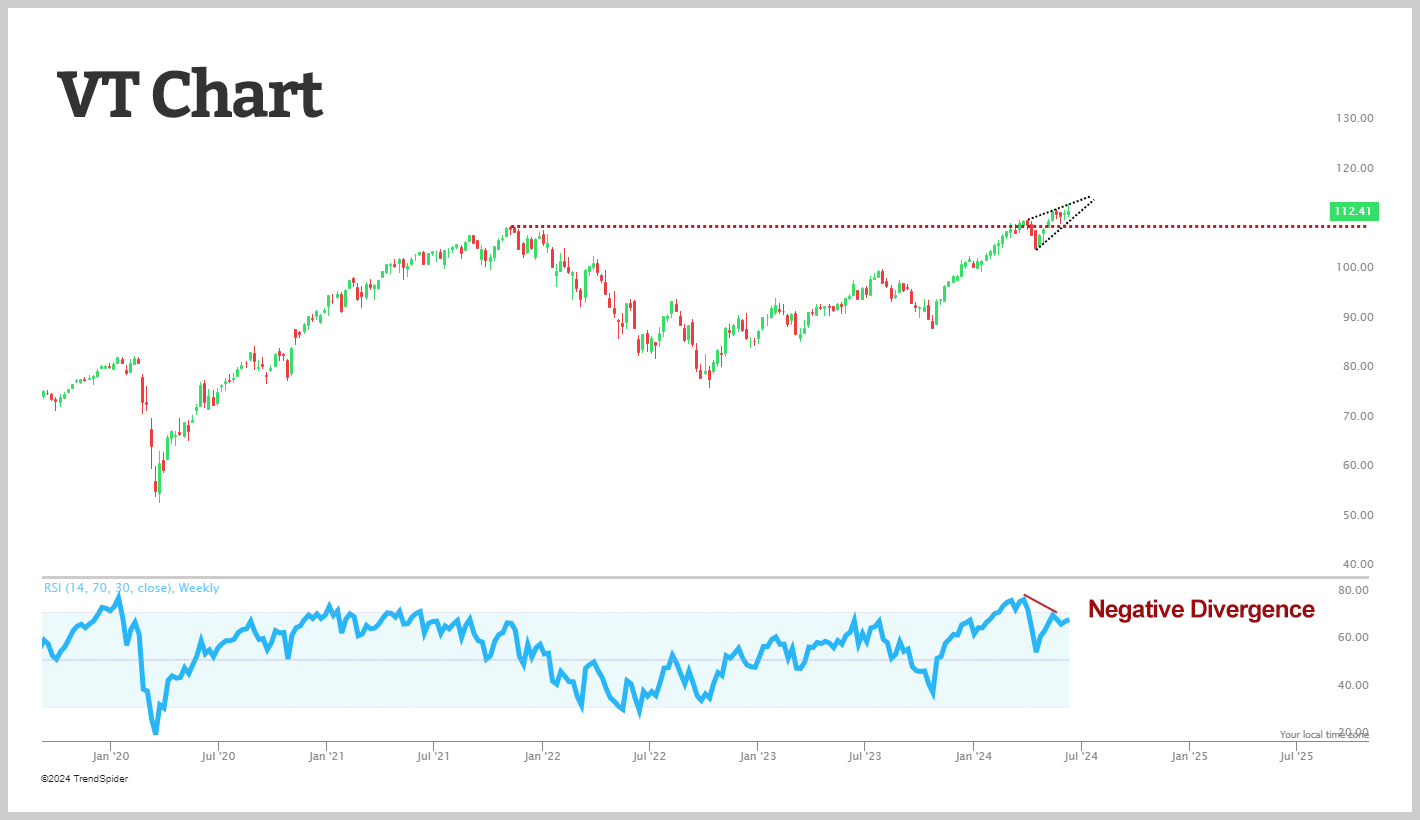
The VT, with its broad range of assets, serves as an excellent indicator of the global stock market’s health. Notably, the fund has exceeded its previous all-time highs from late 2021 on two occasions. It first peaked slightly higher in March of this year, followed by a dip to its April low. As of last week, the fund has reached new all-time highs again.
It’s also important to consider the Relative Strength Index (RSI) on this weekly chart, where each bar represents a week. The RSI is showing a negative divergence as indicated by the red line, which could suggest weakening momentum at these higher levels.
However, does this signal a market peak for VT? I don’t think so. And even if the market were to turn downward, I would still be cautious about placing short trades.
Let’s take a closer look at the daily chart of VT to understand better why I hold this view…
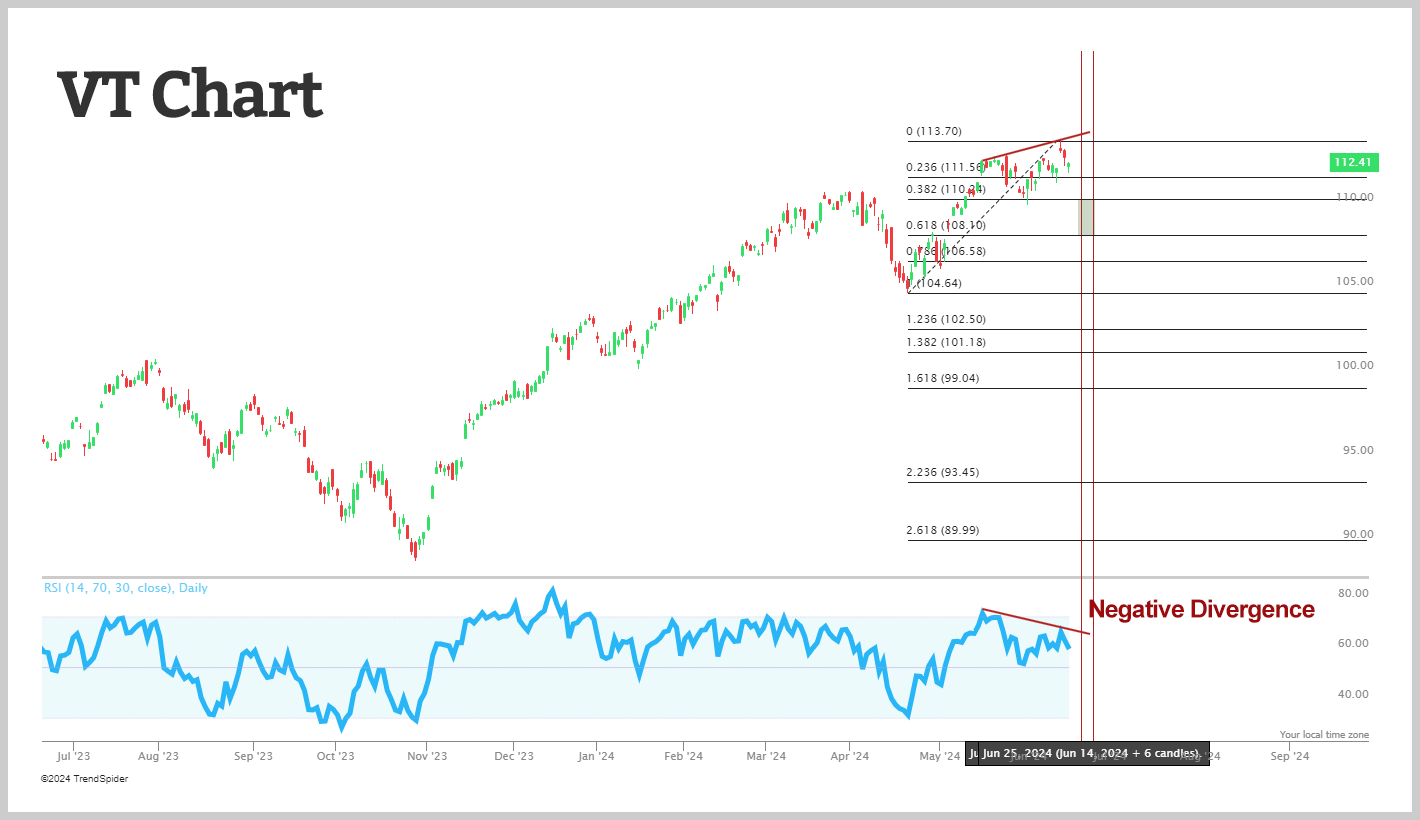
This chart, similar to the weekly VT chart, also displays a negative divergence in the RSI compared to last week’s high prices. We are now observing a decline in these indicators.
Let’s consider the possibility of increased volatility and a market correction occurring either next week or the week after. I’ve previously pointed out that the period from June 20 to June 25 is expected to be a significant marker. If the market bottoms out around this time, it could present a good opportunity to buy during this dip.
Notice the green box on the chart. This represents the Fibonacci confluence zone that I am monitoring closely over the next week or so. Should the market reach this zone during the mentioned time frame and the RSI suggests oversold conditions within a continuing strong uptrend, it could be an ideal time to consider buying rather than selling.
With both U.S. and global stocks reaching new all-time highs, maintaining patience is crucial at this moment. Markets are inherently variable, and as Herbert Hoover once remarked, it’s important to keep an eye on the “whole situation.”
So, even with potential volatility on the horizon, our strategy remains consistent: we continue to look for and invest in the most profitable setups available.