Tech stocks are facing downward pressure this morning due to Netflix (NFLX) and Tesla (TSLA) experiencing declines. However, other indices like the Dow and Russell 2000 are relatively stable today.
It’s worth noting that this is not the right time to engage in short-selling strategies in the market, at least not with any type of size, as it may not be favorable set up for such a strategy.
Looking ahead, a correction is anticipated to unfold later this month or in the early part of the following month. As part of this analysis, two charts in the semiconductor sector I want to take a look at.
The first chart, SMH:
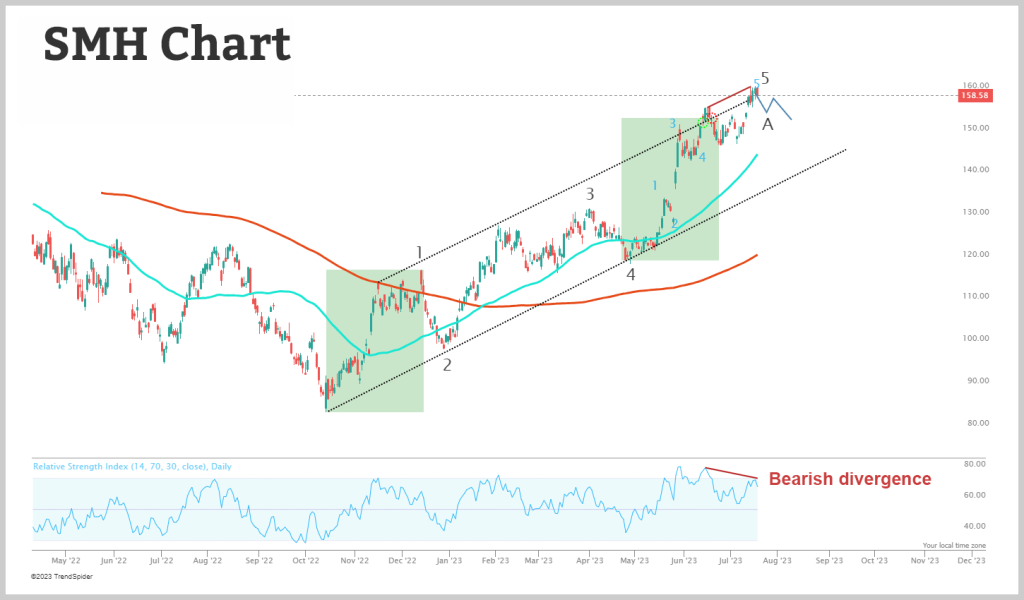
Here we see a noticeable rally from the October low, marked by two waves – a larger one in black and a smaller one in blue. An ABC corrective wave is likely to follow.
When two waves of different degrees converge at a common wave 5, it often results in a significant pullback, which requires caution.
Additionally, bearish divergence is observed, depicted by a thick red line, showing that the stock’s price is higher while the RSI is lower over the same period. This divergence can persist for some time before leading to increased volatility, but today’s price action might indicate short term fading in bullish momentum.
Now, let’s take a look at TSM.
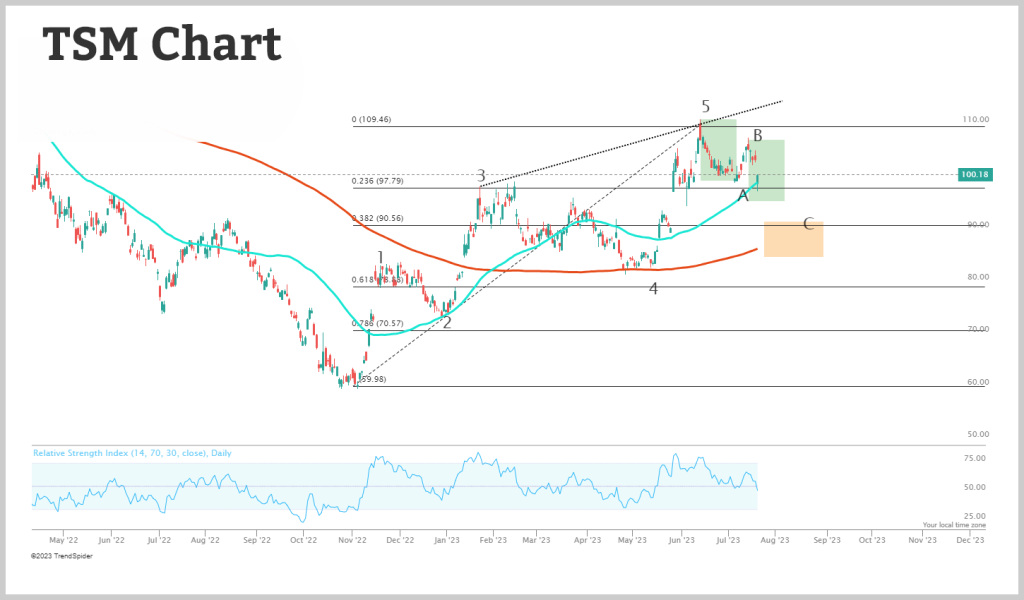
The chart reveals a solid uptrend, characterized by an upward sloping channel with the black dotted line. Several support areas are highlighted, including the Fibonacci retrace level, the 50-day moving average (DMA) in blue, and the symmetrical move (green boxes).
The stock is currently aligning with these support levels during its upward trend, signaling a potential buy opportunity. The main support area for TSM is seen between $97 and $92.
In the worst-case scenario, the stock could drop to the lower level of the channel and the 200-DMA in red, situated around $86-$85, as marked with the orange box.
The recommended strategy is to allow the correction to run its course before considering new positions in AMD and getting aggressive with SMH call options.

